Bitcoin Correction more likely to last a very long time with major price ranges ahead | 2 July
BTC Bitcoin Price, Bitcoin Price Risk Analysis
(Previous week in brackets)
| BITCOIN BTC/USD | Monthly | Weekly | Daily | |||
|---|---|---|---|---|---|---|
| 34,682 (32,275) |
||||||
| Trend | ↓ (↓) | ↓ (↓) | ↑ (↓) | |||
| % Risk Weight |
55 (68) | 17 (18) | 70 (34) | |||
| Allocation Limit(0%) | Invested | 0% (0%) | ||||
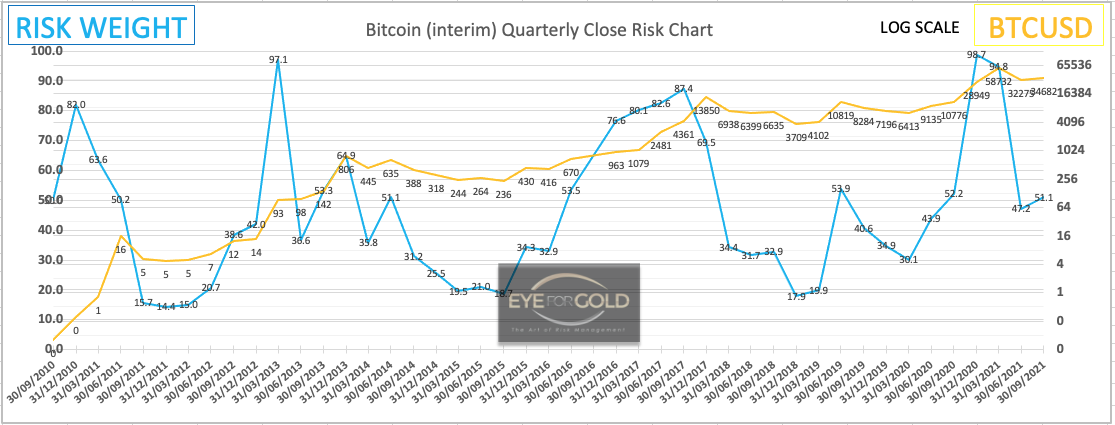
3 July close: The most relevant chart patterns for Bitcoin at the start of Q3 is a continuation of a stong Monthly downtrend and Daily risk quickly moving into 70% risk on a relatively small rally.
 Not sure whether this is on purpose, probably, but this well known and easily recognized suit belonging to one of the most brilliant financial market entertainers and a huge BTC supporter has been wearing the Bitcoin Broche upside down since a few weeks. That says it all. Some Crypto whales say technicals don't matter in Bitcoin or crypto. Well, maybe not until they do and not just with hindsight, technical tools when applied within a proper financial risk management approach do tell a major story. The title is 'BE CAREFUL' Some people will be right and most will be wrong, as always. Right now risk remains high until some of these crypto markets really signal a bottom. As avoiding risk is in our system at least, Bitcoin doesn't look attractive. We shouldn't listen to screamers telling us why Bitcoin is digital gold. Because it isn't. It's Bitcoin and yes maybe it will go to 220k or much higher. The quantum leap that crypto devs are driving though is extremely exciting and will lead to many new solutions, but 'the powers that be' will eventually determine the outcome and what is accepted. No point speculating on the ultimate solution or what is a hype and what is not. This is one financial market that, right now, still looks high risk. It did that already in January 2021 and pushed through the roof during Q1. Huge gains have been made and partly lost again. Some lost their shirt in the recent correction or are about to. Bitcoin was a bubble in Q1 and corrected 55% thusfar currently at -48%. Someone bought that top and Bitcoin traded above 60,000 for 5 consecutive days and another few weeks above $55,000. If this is the Columbus Egg, why scream it off rooftops? Why? Whales make more money that way and that is the ONLY reason. Tghe idea of owning a basket of startup tokens with great potential makes total sense though and Bitcoin surely can have a slice of that pie, but when greed rises beyond belief something will give. 'BE CAREFUL'
26 June close: In any highly speculative financial asset class there will be a day of reckoning. And Anything that can go wrong will go wrong... 'for certain investors'. It doesn't mean they can't be right, but timing and market respect mean everything when managing risk. Last week Bitcoin reached a fresh low in the current downtrend which just confirms that the risk of a medium bottom already in place (28,800) is near zero. Monthy risk weight trend is strongly down with relatively little history in the pocket. Weekly, historically, is in an unfinished downtrend and we haven't seen a short term chart pattern with an outspoken bottom.
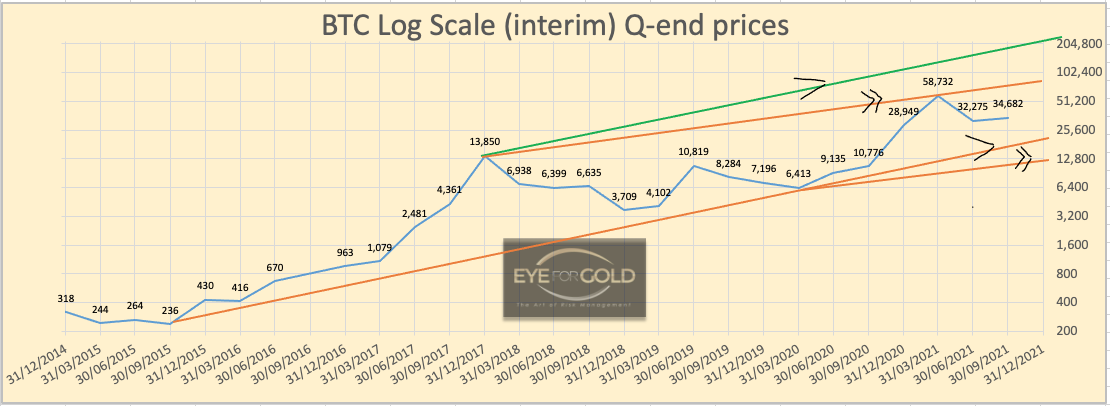
Since December 2020, 7 months of bottom to top and vice versa price ranges between $12,000 and $29,500, 4 months up and now 3 months down where an upmonths is a higher close than opening and vice versa. We may have already witnessed what can be described as a blow off top. We would argue that the risk is that this current correction may last much longer than desired by most investors. 10 years of very precise daily data looks more like we have completed a first primary 5 wave (Elliott) in this modern day asset, which may even be the 'only' massive range of an asset class the current generation of investors will see. This applies to lesser extend to many of the peer tokens. If this 5th major correction of BTC over the past 11 years is indeed of a primary nature the chances are that the next drop will even be sub $10,000 simply because the Dec 2017 peak isn't real support. Then a rally back to 'whereever' (say $35k) followed by another major new bottom possibly into the 1,000 to 3,000 range. This is a real risk scenario today and basically means exit.
We also notice that Gold vs Bitcoin Ratio (already recovered to 0.054) has weekend (Saturday/Sunday) gaps going up to 0,10 and even 0,20. This means a Bitcoin price level of 1/2 ($16,000) resp. 1/4 ($8,000) of the current price with the same gold price. We stay out of this BTC market and would be looking for individual native startup tokens with serious long term potential. Fortunately there are plenty of those, even though the initial reactions are that all tokens will follow the leader as we are witnessing today.
We have added a linear quarterly chart to the inflation proof log scale charts below to visualise that five wave primary trend with wave I finishing in 2014, wave III in 2017 and wave V 3 months ago. This doesn't mean that we can't be wrong, but the risk level is still plenty high. No Change.
Bitpanda Pro - BEST Token Price Risk Analysis
(Previous week in brackets)
| Bitpanda - BEST/EUR | Monthly | Weekly | Daily | |||
|---|---|---|---|---|---|---|
| 0.8719 (0.8875) | ||||||
| Trend | ↓ (↓) | ↓ (↓) | ↓ (↑) | |||
| % Risk Weight |
59 (58) | 15 (16) | 23 (28) | |||
| Allocation Limit(variable) | Invested | 100% (100%) | ||||
BEST token live price
Bitpanda BEST analysis
03 July 2021:Bitpanda's BEST is no different than Bitcoin when it comes to managing financial risk. Our portfolio has suffered but risk has been reduced to subzero, which allows taking a wider view to other potential crypto investment vehicles. Our existing portfolio earns a monthly reward which is guided every month towards still very low inflation fiat to be either re-invested or distributed. At the same time we are slowly building a small portfolio of high potential altcoins and native tokens from our watchlist and beyond representing some of the early and more recent crypto startups. Cross border exchange and Defi related products are on our watchlist. All investments will be small enough to never drive high risk wealth depreciation. Precious metals however remain our core protection at 50%. For now. No Change.
Even though Bitpanda, like many of their peers, seems to have experienced growth pains and an apparent slowdown of some early promise high potential business development products, the Bitpanda exchange's technical features and mobile usability seem to be working very well and we look forward to some interesting company news in coming months.
26 June 2021: BEST market risk position is no different than for Bitcoin or most other peer tokens. If the token drops further, which we expect right now with an objective closer to 0.60 or even lower), we will continue to exchange the monthly rewards for cash at whatever bid prevails and reserve the cushion for a fresh allocation into a variety of high potential development tokens from our watchlist if good opportunities arise based on clear bottoming risk patterns. No Change.
S&P, Stock Indices, Equities, High Risk, No Limits
S&P 500 Standard & Poor's 500 Price Risk Analysis Forecast
(Previous week in brackets)
| Standard & Poor 500 | Monthly | Weekly | Daily | |||
|---|---|---|---|---|---|---|
| 4350 (4284) | ||||||
| Trend | ↑ (↑) | ↑ (↓) | ↑ (↑) | |||
| % Risk Weight |
99 (98) | 91 (92) | 98 (90) | |||
| Max Allocation 20% (20%) | Invested | 0% (0%) | ||||
02 July 2021 close: We would never invest at risk levels that are beyond imagination. We are out for 3 years come October. Did we lose a massive opportunity. You bet! Did we lose sleep over it. Not a second. Do equity markets signal any change to the near perpetual high risk situation. No, they don't. Investors that can hold out till they die are best enjoying life and not worry about opportunities lost. The world wide response to and effects of Covid-19 certainly should have taught us something.
Having said this; next week We will remove S&P from our comment list until further notice. Our risk analysis model is unlikely to change until something triggers the unavoidable. What goes up, comes down.
25 June 2021 close: The bullish short term divergence (Daily vs Weekly) last week pushed the market back up as it has done for the past 2 years. We are back in high risk mode for all timescales at this week's close. Interim Monthly risk weight trend did turn back up with 4 days to go till end of June. Next week's update will show a fresh monthly direction. No Change and staying away from this equity index.


