
Gold/USD live price, Weekly update risk analysis relative to Long Term Monthly(LT-M), Medium Term Weekly(MT-W), Short Term Daily(ST-D) and Hourly(not shown) data
(Previous week in brackets)
Close 25 October: 1504 (1487)
| Gold/USD | LT-M | MT-W | ST-D |
|---|---|---|---|
| Trend | ↓ (↓) | ↓ (↓) | ↑ (↑) |
| % Risk Weight |
85 (85) | 61 (65) | 52 (50) |
| Allocation | 100% (100%) | ||
Gold reserves and asset re-allocation for insurance purpose.
Last week: Market was flat in the week ending 18 October and virtually unchanged with daily risk weight turning up. Last week we explained the reason for defying technical gravity. No change in that respect and we stay fully invested expecting the weekly to turn up again following a stronger price move despite the monthly getting fairly overbought, but experience tells this could continue for quite some time. There is never absolute certainty that our risk analysis holds its own, but this is a situation where we could easily be wrong footed, especially after the strong and unbroken LT rally of the past 12 months.
Gold/EUR live price, Weekly update risk analysis relative to Long Term Monthly(LT-M), Medium Term Weekly(MT-W), Short Term Daily(ST-D) and Hourly(not shown) data
(Previous week in brackets)
Close 25 October: 1357 (1334)
| Gold/EUR | LT-M | MT-W | ST-D |
|---|---|---|---|
| Trend | ↓ (↓) | ↓ (↓) | ↑ (↓) |
| % Risk Weight |
89 (88) | 57 (65) | 43 (18) |
| Allocation | 100% (100%) | ||
Last week: A strong dollar pushed Gold down a bit further against Euro which was expected. We said that price could go weaker but a strong cushion is the main reason to allow this market to resume its uptrend in due course. Maybe MT-Weekly risk weight needs to drop further to diverge into a bullish scenario again. We are confident the leading trend is still up and that we can experience a series of risk weight highs over the next 12 months again. Just like the 2006 -2011 period. No Change
Gold/GBP live price, Weekly update risk analysis relative to Long Term Monthly(LT-M), Medium Term Weekly(MT-W), Short Term Daily(ST-D) and Hourly(not shown) data
(Previous week in brackets)
Close 25 October: 1172 (1146)
| Gold/GBP | LT-M | MT-W | ST-D |
|---|---|---|---|
| Trend | ↓ (↓) | ↓ (↓) | ↑ (↓) |
| % Risk Weight |
84 (82) | 33 (47) | 20 (12) |
| Allocation | 100% (100%) | ||
Last week: Sterling has been particularly strong gaining another 3%. This strength will not last as we will explain in the currency section. Gold will resume its primary uptrend against GBP once this correction ends, and it looks like we are not that far off. No Change to stay with full allocation
Silver/USD live price, Weekly update risk analysis relative to Long Term Monthly(LT-M), Medium Term Weekly(MT-W), Short Term Daily(ST-D) and Hourly(not shown) data
(Previous week in brackets)
Close 25 October: 18.00 (17.51)
| Silver/USD | LT-M | MT-W | ST-D |
|---|---|---|---|
| Trend | ↑ (↑) | ↑ (↓) | ↑ (↑) |
| % Risk Weight |
72 (70) | 54 (55) | 62 (53) |
| Allocation | 100% (100%) | ||
Last week: Daily risk weight trend turned up this week. Silver, being a semi, at least, manipulated commodity requires patience. The primary trend still looks firmly in place in spite of the relatively strong correction the past 6 weeks. No change
Silver/EUR live price, Weekly update risk analysis relative to Long Term Monthly(LT-M), Medium Term Weekly(MT-W), Short Term Daily(ST-D) and Hourly(not shown) data
(Previous week in brackets)
Close 25 October: 16.23 (15.68)
| Silver/EUR | LT-M | MT-W | ST-D |
|---|---|---|---|
| Trend | ↓ (↓) | ↑ (↓) | ↑ (↓) |
| % Risk Weight |
78 (75) | 54 (56) | 45 (25) |
| Allocation | 100% (100%) | ||
Last week: The Silver/Euro correction following a week of more strength for Euro vs USD is shallowing. Otherwise the same reasoning as for Silver/USD applies. Keep full allocation Silver. No change
Silver/GBP live price, Weekly update risk analysis relative to Long Term Monthly(LT-M), Medium Term Weekly(MT-W), Short Term Daily(ST-D) and Hourly(not shown) data
(Previous week in brackets)
Close 25 October: 14.01 (13.49)
| Silver/GBP | LT-M | MT-W | ST-D |
|---|---|---|---|
| Trend | ↓ (↓) | ↓ (↓) | ↑ (↑) |
| % Risk Weight |
73 (72) | 40 (47) | 30 (15) |
| Allocation | 100% (100%) | ||
No Change.
Last week: Strength of Sterling against just about everything else financial has become speculative and we may expect a fairly strong correction fairly soon. From what level remains to be seen but risk against GBP is increasing. It means No Change in keeping full allocation Silver vs GBP.
Gold/Silver Ratio live price, Weekly update risk analysis relative to Long Term Monthly(LT-M), Medium Term Weekly(MT-W), Short Term Daily(ST-D) and Hourly(not shown) data
(Previous week in brackets)
Close 25 October: 83.25 (84.73)
| GOLD/SILVER Ratio | LT-M | MT-W | ST-D |
|---|---|---|---|
| Trend | ↓ (↓) | ↓ (↑) | ↓ (↓) |
| % Risk Weight |
44 (45) | 40 (41) | 34 (42) |
| Allocation | 50/50 AU/AG (50/50 AU/AG) | ||
Last week: Technically the risk weight down trend is still in play with a great opportunity to participate in the correction towards equilibrium. This may become a long term position with many ups and downs. No Change for now
FX: EUR/USD, USD/CHF, GBP/USD, USD Index, GBP/EUR, Bitcoin
EUR/USD FX live price, Weekly update risk analysis relative to Long Term Monthly(LT-M), Medium Term Weekly(MT-W), Short Term Daily(ST-D) and Hourly(not shown) data
(Previous week in brackets)
Close 25 October: 1.1075 (1.1115)
| EUR/USD | LT-M | MT-W | ST-D |
|---|---|---|---|
| Trend | ↑ (↑) | ↑ (↑) | ↓ (↑) |
| % Risk Weight |
7 (8) | 42 (30) | 72 (89) |
| Allocation | 100% (100%) | ||
Last week: Some bearish divergence between Daily and Weekly may push the dollar up a little this coming week, but the MT and LT picture looks like the primary dollar downtrend that started in March 2017 has been re-established after a long, slow and frustrating 2018/19 rally. No change in keeping long dollar risk fully covered
USD/CHF FX live price, Weekly update risk analysis relative to Long Term Monthly(LT-M), Medium Term Weekly(MT-W), Short Term Daily(ST-D) and Hourly(not shown) data
(Previous week in brackets)
Close 25 October: 0.9935 (0.9820)
| USD/CHF | LT-M | MT-W | ST-D |
|---|---|---|---|
| Trend | ↑ (↓) | ↓ (↓) | ↑ (↓) |
| % Risk Weight |
54 (51) | 68 (70) | 50 (25) |
| Allocation | 100% (100%) | ||
Last week: Dollar weakness accellerated against CHF on Wednesday into Friday close and it may well be due to GBP strength where speculative positions are likely to be very high increasing GBP risk rapidly. Nevertheless, the dollar is weakening across the board and our technical instruments have been expecting this for quite some time. No Change either for $/CHF. Stay with full hedge on long dollar exposure
Cable GBP/USD FX live price, Weekly update risk analysis relative to Long Term Monthly(LT-M), Medium Term Weekly(MT-W), Short Term Daily(ST-D) and Hourly(not shown) data
(Previous week in brackets)
Close 25 October: 1.2815 (1.2920)
| GBP/USD (Cable) | LT-M | MT-W | ST-D |
|---|---|---|---|
| Trend | ↑ (↑) | ↑ (↑) | ↓ (↓) |
| % Risk Weight |
25 (25) | 78 (70) | 82 (89) |
| Allocation | 100% (100%) | ||
Last week: Sterling added another 2% to the strong performance of the week ending October 11. Thew tempo of this Cable rally is a bit stretched although the LT technical picture is the same for GBP vs USD. The dollar looks weak LT but may run our of steam vs GBP a bit earlier for a temporary correction. For now there is a protective hedge cushion and we see room for a bit further strength short term, albeit a bit speculative. No Change
USdollar Index Weekly update risk analysis relative to Long Term Monthly(LT-M), Medium Term Weekly(MT-W), Short Term Daily(ST-D) and Hourly(not shown) data
(Previous week in brackets)
Close 25 October: 97.83 (97.14)
| USD Index | LT-M | MT-W | ST-D |
|---|---|---|---|
| Trend | ↑ (↓) | ↓ (↓) | ↑ (↓) |
| % Risk Weight |
88 (86) | 45 (60) | 22 (5) |
| Allocation | 100% (100%) | ||
Last week: The Index turned down sharply from the beginning of last week and reached the lows we saw in August. Even though Daily risk weight is in oversold territory below 10%, the dollar looks weak across the board. MT and LT risk weight is leading and long dollar exposures must be kept fully covered
GBP/EUR FX live price, Weekly update risk analysis relative to Long Term Monthly(LT-M), Medium Term Weekly(MT-W), Short Term Daily(ST-D) and Hourly(not shown) data
(Previous week in brackets)
Close 25 October: 1.1560(1.1579)
| GBP/EUR | LT-M | MT-W | ST-D |
|---|---|---|---|
| Trend | ↑ (↑) | ↑ (↑) | ↓ (↓) |
| % Risk Weight |
45 (45) | 87 (84) | 86 (87) |
| Allocation | 80% (100%) | ||
Last week: 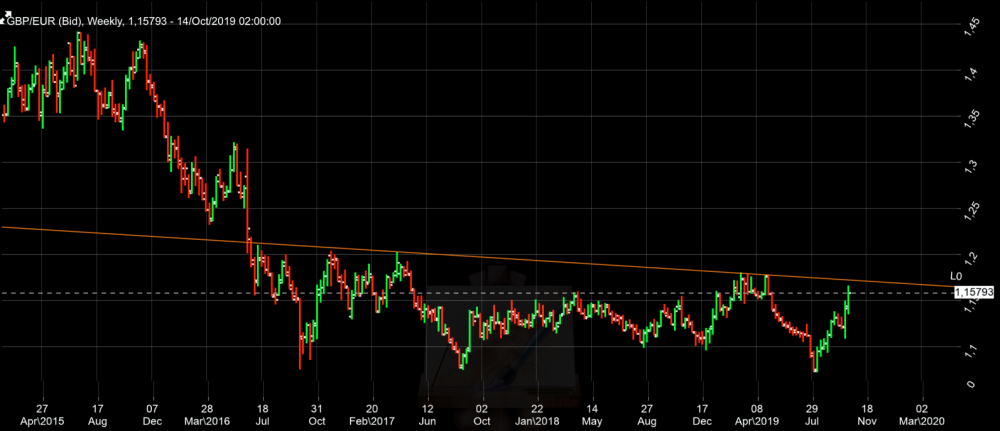
This image feels like Sterling has paused a longer term downtrend against the EURO within a 10% range. This is part of the risk that now also influences positioning and if GBP is to weaken again and to continue the trend that started in 2015,the UK Treasury will happily let this happen to eleviate a fundamentally weak financial status.
The resistance line between the highs of early 2017 and early 2018 maybe a bridge too far for GBP. It could penetrate at 1.1725 and even follow through to the 1.20 level but risk weight is telling the story of a possible ending of a 3 year correction ag Euro that started in October 2016. The ST and MT risk weight is already in overbought territory and we would feel happy to unwind 20% of the position on Monday, leaving an 80% short GBP cover. With ST-D and MT-W at these levels a further sprint and crossing of 1,1700 could be reason to unwind further but we need to see more evidence of that MT risk becoming overweight and turning down. The change is to unwind to 80% cover on short GBP exposure
BTC Bitcoin Price, Weekly update risk analysis relative to Long Term Monthly(LT-M), Medium Term Weekly(MT-W), Short Term Daily(ST-D) and Hourly(not shown) data
(Previous week in brackets)
Close 25 October: 8655 (7947)
| BITCOIN BTC/USD | LT-M | MT-W | ST-D |
|---|---|---|---|
| Trend | ↓ (↓) | ↑ (↓) | ↑ (↓) |
| % Risk Weight |
55 (54) | 15 (7) | 45 (28) |
| Allocation | 0% (0%) | ||
Last week: Since the June high at 14,000 the MT time frame can be expected to show bullish divergence before this market can be expected to restart an uptrend. Strong fundamentalists tend to also get influenced by market forces that they haven't foreseen and cannot explain. Nouriel Roubini is such person who seems to embrace the possibility of Bitcoin becoming a store of value. But at what level? Traditionally such change in opinion is more likely than not to confirm the original thesis. We are more aligned with his original view until this market becomes more transparent and probably at much lower levels including a much depreciated USDollar. No Change
Remaining 'opening up' gap still to fill at 2828. We exclude weekend action to determine opening gaps as major players are not participating in size.
If this market is poised to turn from extremely overbought (Dec 2017) to completely oversold, it doesn't appear to be finished.
Dow Jones Weekly update risk analysis relative to Long Term Monthly(LT-M), Medium Term Weekly(MT-W), Short Term Daily(ST-D) and Hourly(not shown) data
(Previous week in brackets)
Close 25 October: 26958 (26770)
| US30 (Dow Jones) | LT-M | MT-W | ST-D |
|---|---|---|---|
| Trend | ↑ (↓) | ↑ (↓) | ↑ (↓) |
| % Risk Weight |
90 (85) | 82 (72) | 92 (55) |
| Allocation | 0% (0%) | ||
Last week: The Dow Jones index remains high risk and potentially carries a value that incorporates a massive future weakening of the USDollar. Major corporations in the financial industry have no choice but to continue to protect shareholder value with assistance from Central banks and further quantitative easing. It is a completely manipulated market and it may well be naive not to embrace and particpate in full. This index of 30 stocks may well remain very firm for another few years but it does not change the image of high risk-weight looking at a variety of commonly used technical tools. We watch Stochastic, MACD and RSI and all show more downside risk. The latter is the only reason to stay away from this asset class. No Change
S&P 500 Weekly update risk analysis relative to Long Term Monthly(LT-M), Medium Term Weekly(MT-W), Short Term Daily(ST-D) and Hourly(not shown) data
(Previous week in brackets)
Close 25 October: 3022 (2986)
| Standard & Poor 500 | LT-M | MT-W | ST-D |
|---|---|---|---|
| Trend | ↑ (↑) | ↑ (↑) | ↓ (↓) |
| % Risk Weight |
89 (89) | 76 (76) | 91 (91) |
| Allocation | 0% (0%) | ||
Last week: In essence the S&P 500 shows the exact same picture as INDU and most international stock market indices. Sheer financial power has kept this index in a stronger position than most indices whilst the S&P continues pushing for another new high. No Participation, No Change
Brent Crude oil Weekly update risk analysis relative to Long Term Monthly(LT-M), Medium Term Weekly(MT-W), Short Term Daily(ST-D) and Hourly(not shown) data
(Previous week in brackets)
Close 25 October: 59.25 (59.25)
| Brent | LT-M | MT-W | ST-D |
|---|---|---|---|
| Trend | ↓ (↓) | ↑ (↓) | ↑ (↑) |
| % Risk Weight |
29 (25) | 27 (28) | 92 (54) |
| Allocation | 0% (50%) | ||
Last week: On Oct 16 we closed out as ST risk-weight trend turned down at the close of Oct 15. ST risk is relatively hard to predict as long as MT risk-weight remains in a downtrend, unless there is substantial bullish or bearish divergence between different time frames. Nominal risk levels do not offer clear direction so we must stand aside again. It could literally go either way in the next few weeks, hence no investment until a fresh opportunity presents itself