
Will 2022 be a Happy Year for Gold?
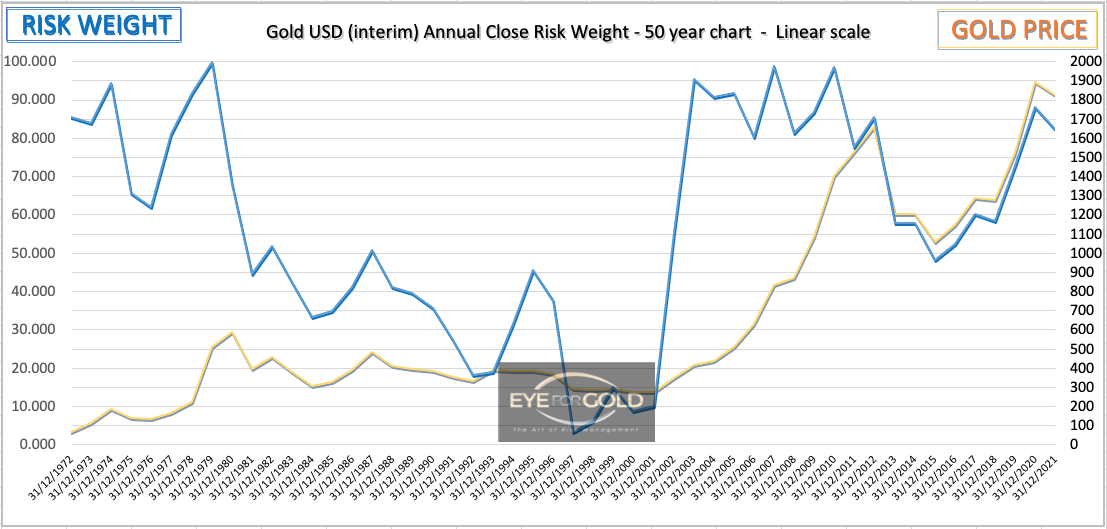
31 December 2021 close: If we take a quick look at the Annual risk chart, Gold is showing bearish divergence vis a vis the lower $1657 year end peak recorded in 2012, whilst the absolute peak was printed in September 2011 at $1920. The question is how to read this annual chart because a bullish or bearish divergence typically works OK on say from 10 minute to monthly charts max. Ou reading is a simple continuation of the uptrend that started in 1933 when the USA abandoned the Gold standard for nationals and then in for foreign nations holding US Dollar exchange reserves. This price could and also 'should' continue into a serious log scale required inflation based chart presentation.
2021 was a mild down year for gold vs USD (down 5.9%), vs GBP (down 2.5%) and CHF (down 0.7%), but UP against the Euro by 3.5% do to a weaker Euro on the world forex market.
The Quarterly Gold close risk chart below shows a more promising picture with a trend that returned to up in Q3 2021 whilst Monthly risk weight only turned up in Dec 2021. Both weekly and Daily confirm the uptrend across most time intervals. Besides the very fundamental orientation in favor of Gold and Silver, and now also Platinum and Palladium for strong industrial demand reasons we have no reason to abandon our approach to precious metals at a time where money creation out of thin air has reached the mind boggling levels where it's at. Not necessarily an inflationary set of policies but certqainly polcies that can scare investors away from fiat. With our lower entry points in 2015 and 2018 we wait for the market (read 'miners') to wake up and realize they need to take more control in their Gold production hedge flows as there is so much hidden value that some day a window of opportunity will arise for private holders of physical metal to swap this for better alternatives. It ios a long term play. China, Russia and Switzerland will be primary beneficiaries of, we believe, an unavoidable revaluation of Gold against all Fiat. It all just takes longer than we initially thought.
Our next market updates will appear at much slower intervals and only if we see the need for a potential fundamental/tehnical risk portfolio adjustement.
17 December close: Last Wednesday's drop quickly reversed within one hour to finish the day on a slightly stronger close with bullish divergence in the Daily time interval. Gold then managed to rise well above $1800 and relatively stronger versus other major currencies as the dollar continued on a strong note. The entire financial space is balancing on a knife's edge and holding gold in a larger insurance portfolio of precious metals is critical. Our technical consensus is lead by medium and long term timeintervals that show an unfinished super cycle uptrend. We must first see a traditional technical pattern to satisfy a serious peak in the making. No change to our long term hold which is Euro based.
Gold/USD Quarterly close risk chart

Gold/USD risk position relative to
Quarterly, Monthly, Weekly and Daily risk weight data.
(Previous update in brackets)
| Gold/USD | Monthly | Weekly | Daily | |||
|---|---|---|---|---|---|---|
| 1829 (1798) |
||||||
| Au Trend | ↑ (↑) | ↑ (↓) | ↑ (↑) | |||
| Au % Risk Weight |
34 (33) | 52 (44) | 85 (54) | |||
| Total PM Portfolio allocation 40% (40%) breakdown: |
Au:12% | Ag:13% | Pt:15% | |||