
Gold to Silver ratio still targets 50 year equilibrium at 57
25 February 2022 close: At the January update the Gold/Silver ratio had dropped into the 75 handle before rallying back towards 80 and easily holding channel resistance at 83.30. The Gold/Silver ratio again closed below the long term support level and appears to be seeking a more fundamental trend change in favor of Silver. The critical move to confirm this is Monthly risk weight rolling over into a fresh downtrend from the present 80% risk. Maintaining our slight overweight silver is seen as low risk because Monthly risk weight is now on bearish divergence path vis a vis quarterly. The latter being up but not at all looking finished on the downside. We are not trying to finetune the allocation betweek metals as long as the broader precious metals space serves as asset insurance. Which it still does in fact.
21 January 2022 close: Our last update was year-end 2021 with the ratio slightly up in the first week of January and then steadily falling into the current 75 handle. This week saw tyhe Gold/Silver ratoi penetrate an 11 month channel with up-sloping support line since June 2021 which broke support at 77.03 closing lowewr for 3 days in a row. This is a bearish signal. It would be typical for the market to rally back into the support area, but wthe medium and long term risk weight pattern suggests a stronger Silver versus Gold in coming months. Even though the monthly time interval risk weight is still up it has moved up to the 70% risk level from around 10% risk weight on a 10% price move from 68 to 75. If Monthly turns down, possibly in February our initial 50 year average target of 57.00 is in sight. No Change to current balanced allocation.
31 December 2021 close: Year end action was slightly in favor of Silver again. Our prediction that the Gold to Silver ratio will return at least to its 50 years average of 57 is very much in play. The only time delay may be caused by the quarterly chart looking still corrective since the large correction down from 1.25. Next updates at slower intervals and only if we change our view to re-allocate.
Gold/Silver ratio Quarterly close risk chart
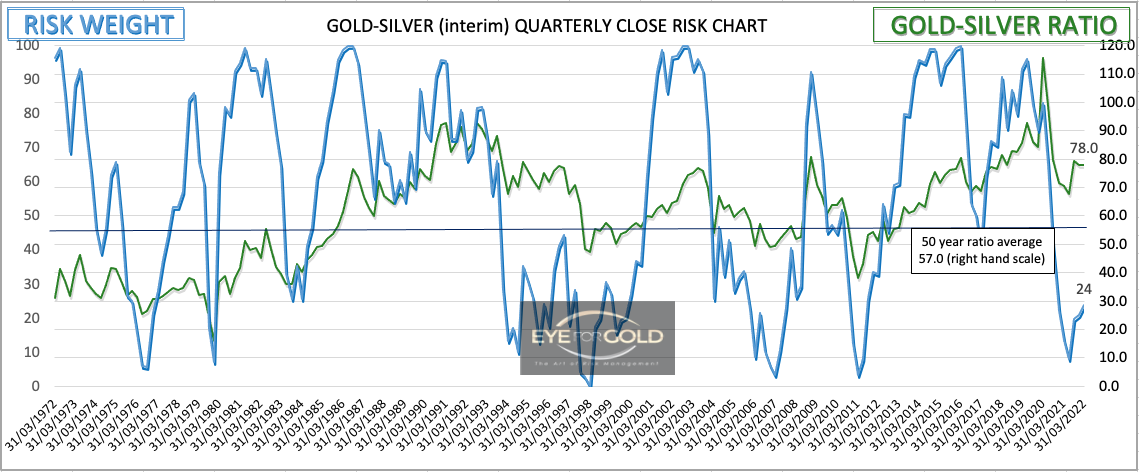
GOLD/SILVER Ratio Risk Position relative to Quarterly, Monthly, Weekly and Daily risk weight data.
(Previous update in brackets)
| GOLD/SILVER Ratio | Monthly | Weekly | Daily | |||
|---|---|---|---|---|---|---|
| 77.64 (75.19) | ||||||
| Trend | ↑ (↑) | ↓ (↓) | ↓ (↓) | |||
| % Risk Weight |
80 (71) | 60 (58) | 30 (10) | |||
| Total PM Portfolio allocation 40% (40%) breakdown: |
Au:12% | Ag:14% | Pt:14% | |||