Platinum should benefit both against Gold and Silver from fresh industrial forward purchases during the next 6 months
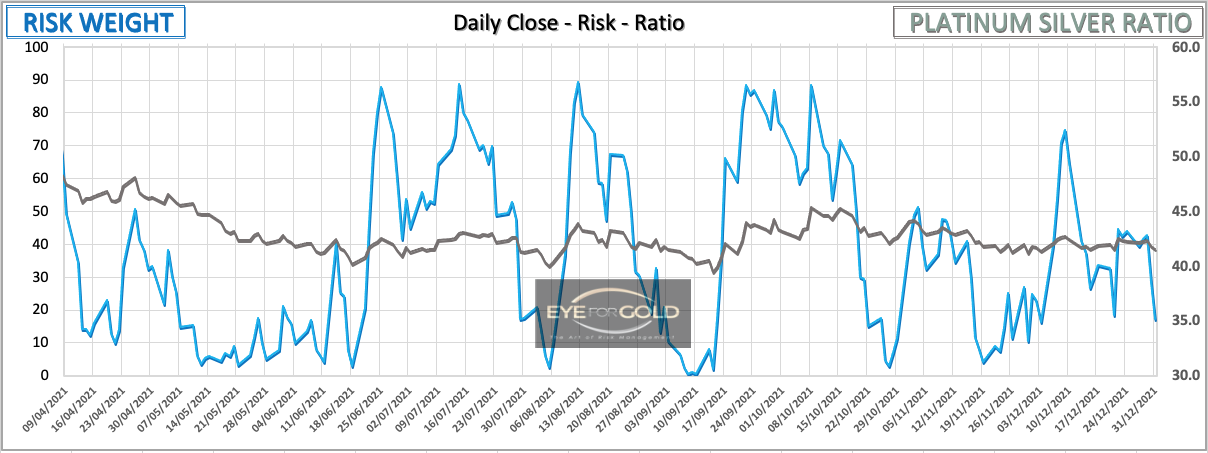
31 December 2021 close: Platinum has consolidated against Silver around the 42 handle for 6 weeks where on balance risk weight time intervals are falling (weaker Platinum) to create plenty more upside for Pt in coming months. We see no reason to worry about the larger Platinum position and still expect a medium term stronger move in favor of Platinum.
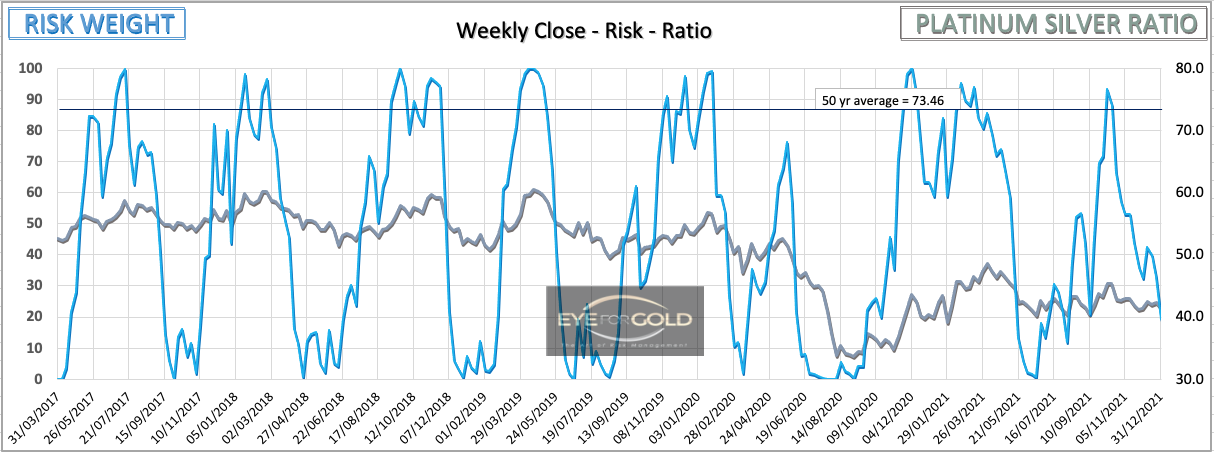
17 December close: Daily risk weight is showing another bullish divergence since our last update twpo weeks ago and so does the weekly risk weight chart. Monhtly is still in a downtrend but overdue to start reaching for increased risk within a few months. Monthly could pivot if Daily and Weekly take a lead ride north. Quarterly also is acting to find that bottom. We believe it did that already in September 2020 at the 33 handle and has a long way to go to meet the 50 year average at 73.50. This may take 3 or 4 years which can push that average down towards the 70-71 level. Even if Silver shows strong performance it doesn't change the purpose of allocating some insurance money to Platinum. No Change.
03 December close Besides the more fundamental reasons for adding Platinum which we started adding against a stronger Euro after the first rally following the March 2020 bottom, Platinum is again now finding strong bullish signal in all time intervals. Daily is evident, Weekly because of the steep drop and likely to remain above one of the three previous low points, Monthly because of a clearly unfinished upside move following the cycle low in 2020 and Quarterly because this also is looking to make another bullish divergence formation which in this case is a very powerful signal. Pt is likely to be strong longer term, hence staying with an equal allocation between Platinum and Silver. The Platinum Silver ratio analysis is important to remain focussed on the risk portolio. We keep this ratio data manually as there are no decent online (API) providers with enough reliable data, and also because we often see charts with print errors that are not being corrected, even when asked, hence providing false data for technical analysis. For now we stay with our long term forecast of closing in on the 50 year daily closing average of 73.50 or a very potential 75% advance from the present Platinum to Silver ratio price level at around 41.00.
Platinum/Silver Ratio Charts
PLATINUM/SILVER Ratio risk position
relative to Quarterly, Monthly, Weekly and Daily risk weight intervals
(Previous update in brackets)
| Gold Platinum ratio | Monthly | Weekly | Daily | |||
|---|---|---|---|---|---|---|
| 41.59 (41.93) |
||||||
| Trend | ↑ (↑) | ↑ (↑) | ↓ (↑) | |||
| % Risk Weight |
48 (48) | 39 (39) | 17 (33) | |||
| Total PM Portfolio allocation 40% (40%) breakdown: |
Au:12% | Ag:13% | Pt:15% | |||


