Platinum USD still looking good for the next 1600 level | 23 April
Platinum Price Forecast relative to Long Term Monthly - Medium Term Weekly - Short Term Daily - and Hourly (not shown) data.
PLATINUM FORECAST
(Previous week in brackets)
| Platinum USD | Monthly | Weekly | Daily | |||
|---|---|---|---|---|---|---|
| 1229 (1203) |
||||||
| PT Trend | ↓ (↓) | ↑ (↓) | ↑ (↑) | |||
| PT % Risk Weight |
83 (82) | 59 (60) | 61 (42) | |||
| PM Distribution Total allocation 30% (35%) |
Pt:35% | Ag:30% | Au:35% | |||
Platinum / USD live price
Platinum comment
23 April 2021 close: Platinum USD suffered during the week from a bit of profit taking and came back into shape on Friday whilst Gold and Silver sold off a bit. The general trend looks firm and we would be looking for an interim peak if the monthly reaches an extreme high risk weight percentage supprted by a short term extreme risk or weekly risk weight showing divergence in its own right. We have seen neither hence comfortable with the Pt portfolio. Long term quarterly risk is up a touch resuming its uptrend. No Change.
16 April 2021 close: The steep price drop early in the week halted at the 1150 handle followed by a rally in line with Gold an Silver closing at 1203 on Friday. All time frames are in position to start finishing the major intermediate trend up, initially towards 1500 and then into new highs.
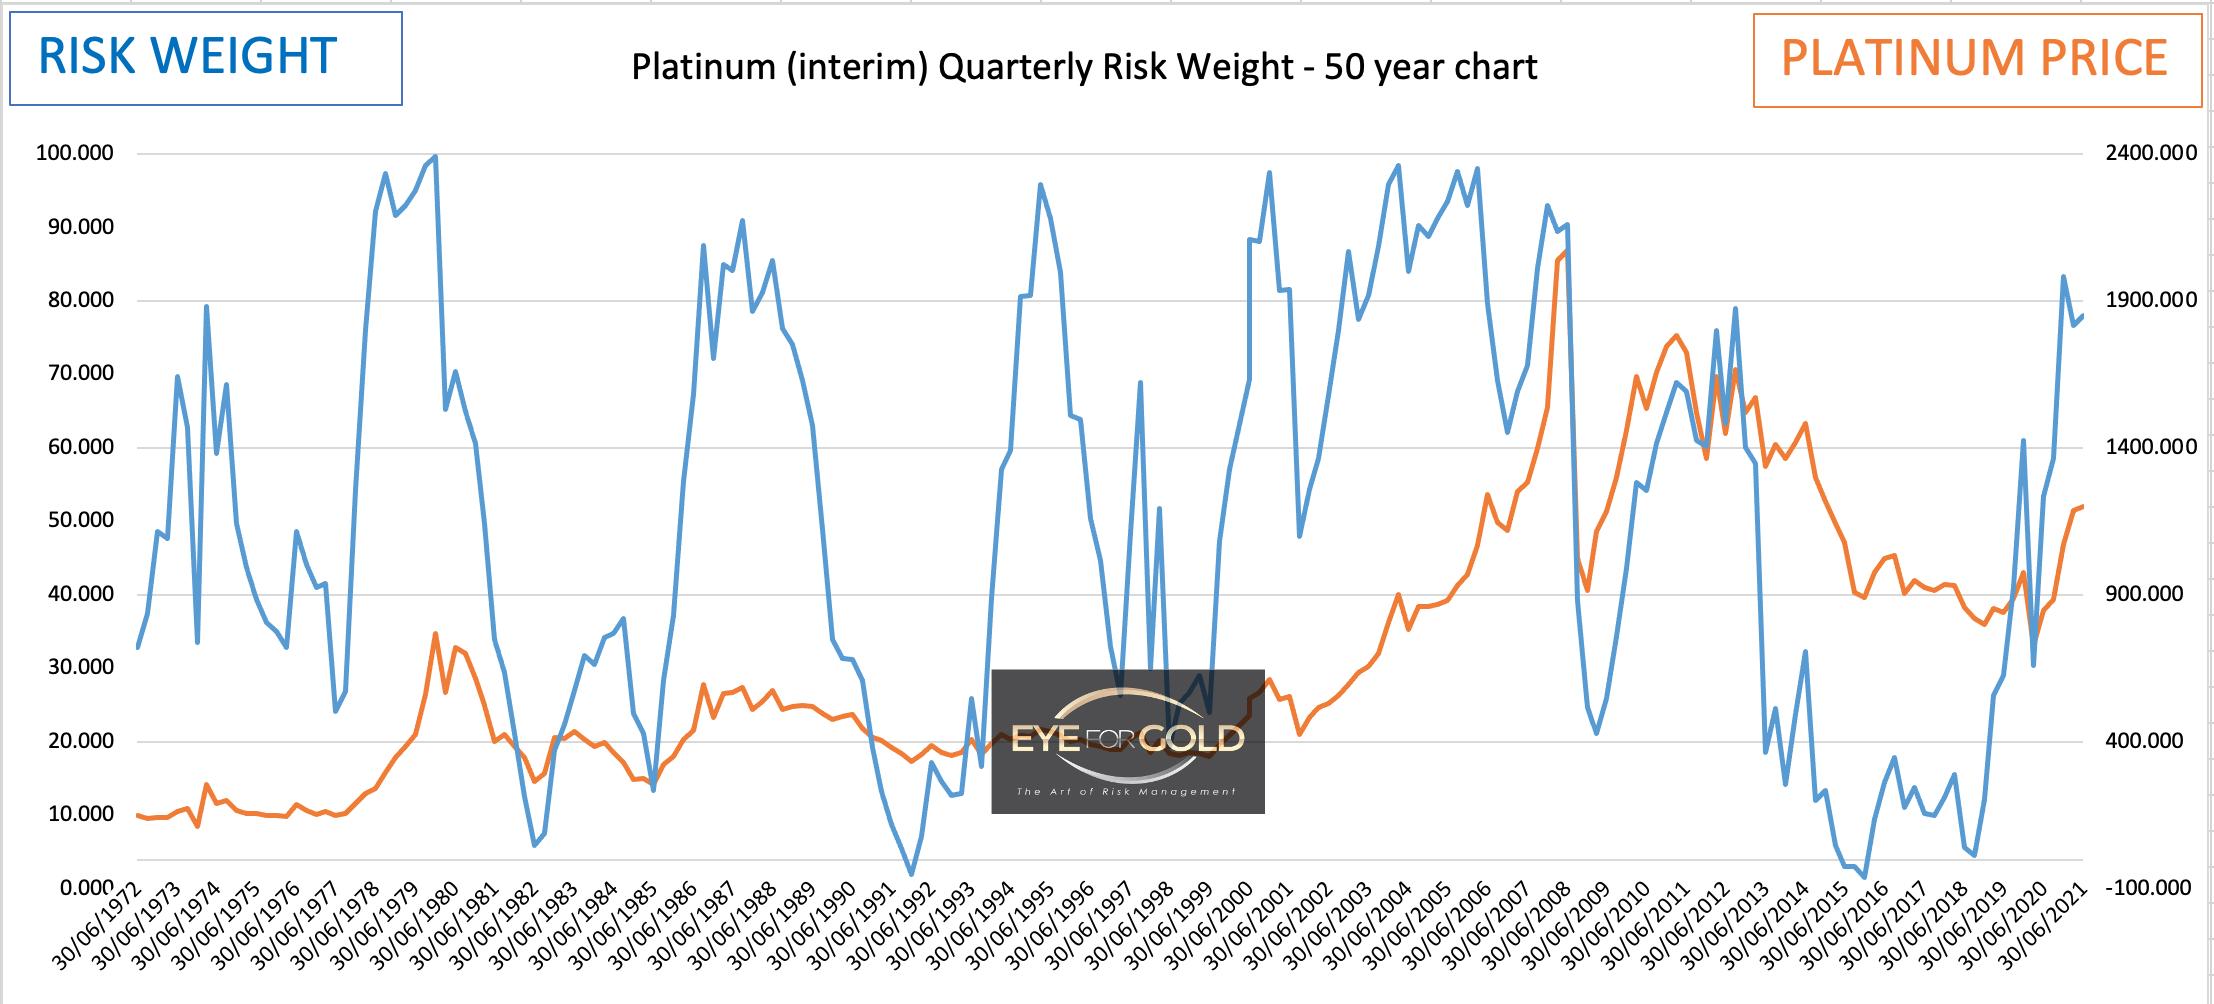
This week have added the Quarterly closing chart for Platinum/USD below. This very long term risk picture is showing an unfinished uptrend where the expectation comparison with gold is similar in that Risk weight of this primary cycle could be in a similar early advance like Gold was in the early years of the 21st century. Several peaks before a final price top is realized. We haven't seen that true long term peak yet.
GOLD/PLATINUM Ratio Price Risk Charts & Analysis
(Previous week in brackets)
| Gold Platinum ratio | Monthly | Weekly | Daily | |||
|---|---|---|---|---|---|---|
| 144.75 (147.60) |
||||||
| Trend | ↓ (↓) | ↓ (↑) | ↓ (↓) | |||
| % Risk Weight |
8 (10) | 23 (24) | 57 (75) | |||
| PM Distribution Total allocation 30% (35%) |
Pt:35% | Ag:30% | Au:35% | |||
Gold/Platinum Ratio Charts
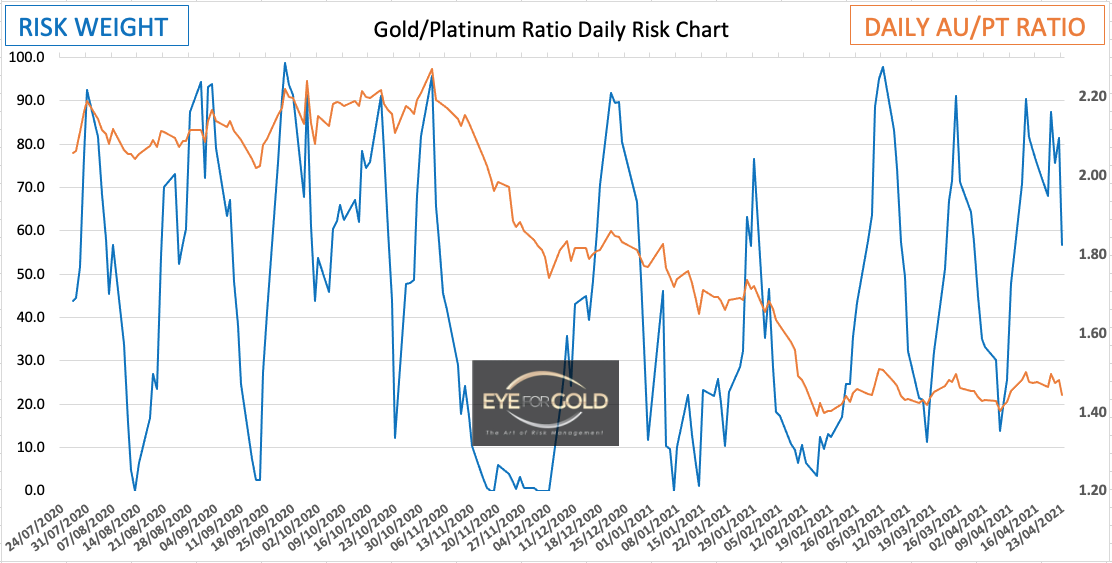
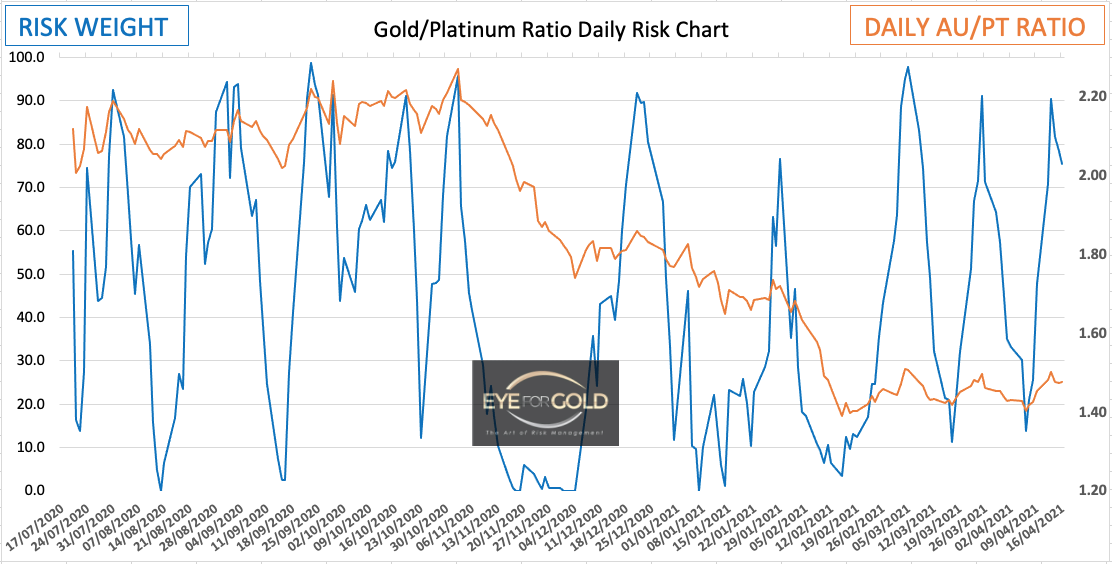
Daily divergence vs Weekly and Monthly risk was being reduced on Friday as Platinum picked up steam after a lackluster week on a mild downslope. Trend is down and we could see another pause at around 1.40 to extend the more complex correction that started in February. Short term downtrend is most likely to comntinue into the coming week. No Change
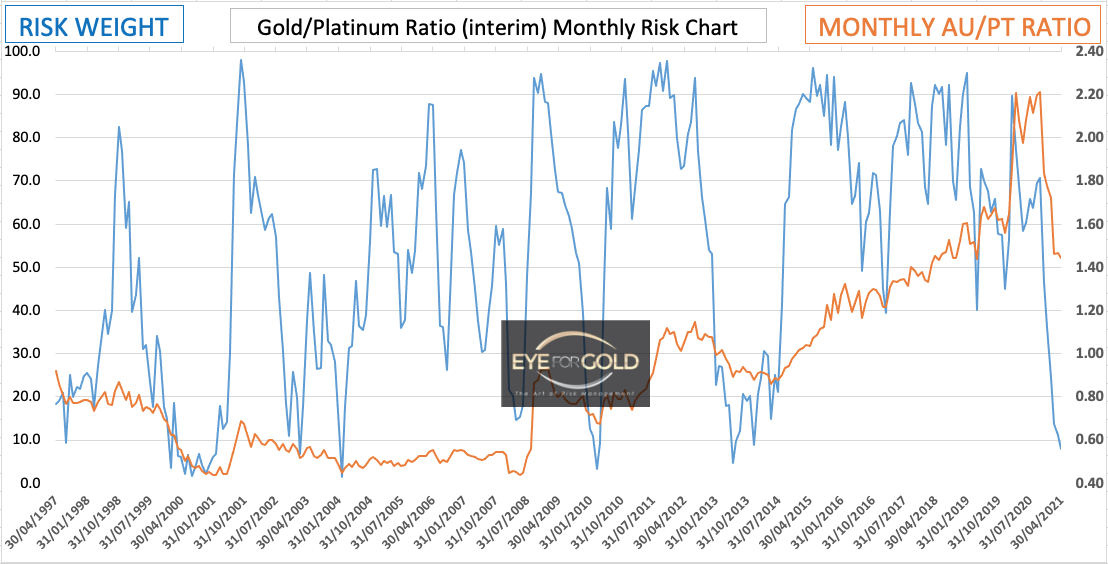
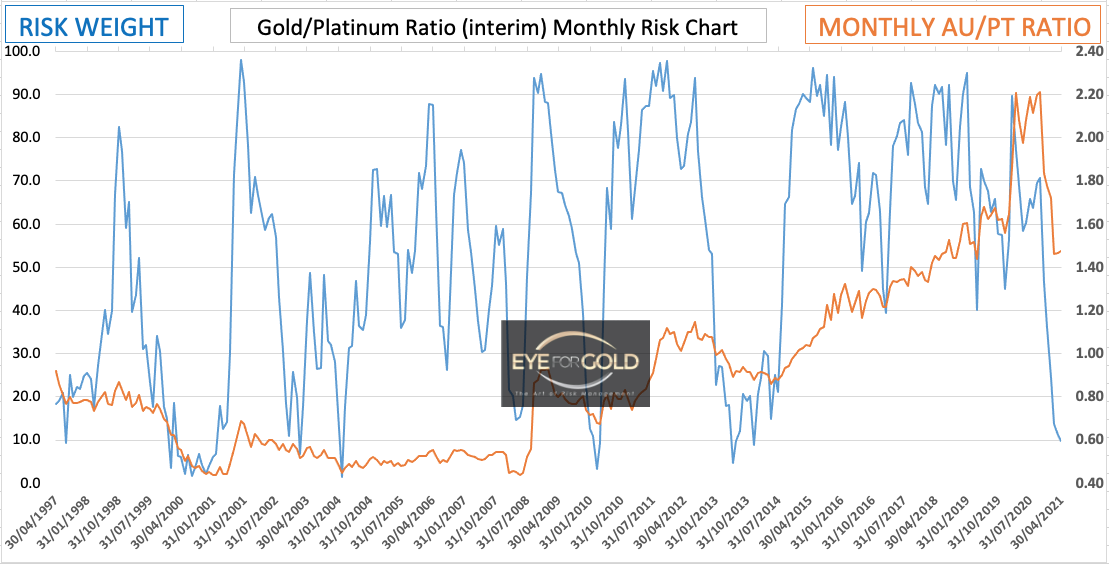
The sharp downtrend in Monthly risk hasn't finished. On May 1st our algo will drop of the fourteenth month which is March 2020 which was the peak month for the Gold/Pt ratio but still closing strong at 2.20. We would expect to see a bit more pressure before a more medium term correction takes place. No Change in staying with the current downtrend.
We would expect the current risk trend to dive close or just below 10% before turning. This probably would require a ratio level of 1.35 to be printed after a lower daily bottom is registered. Sometime later in May perhaps. Patience to stay with Platinum until it reaches the desired minimum equilibrium level of 1:1. Our Platinum allocation and this specific analysis is to not deny the opportunity to benefit from the huge divergence that developed over the past 8 years. Physical platinum, which is the heaviest (precious) metal in nature, therefore is a critical and low risk hold.
Platinum risk weight on Daily moved sharply higher which is a signal that this market is 'just' correcting or pausing short term. In major cycles, the depth of any price move in the opposite direction is always difficult to predict. For now no reason the consider any kind of reversal of the Platinum trend up vs Gold.
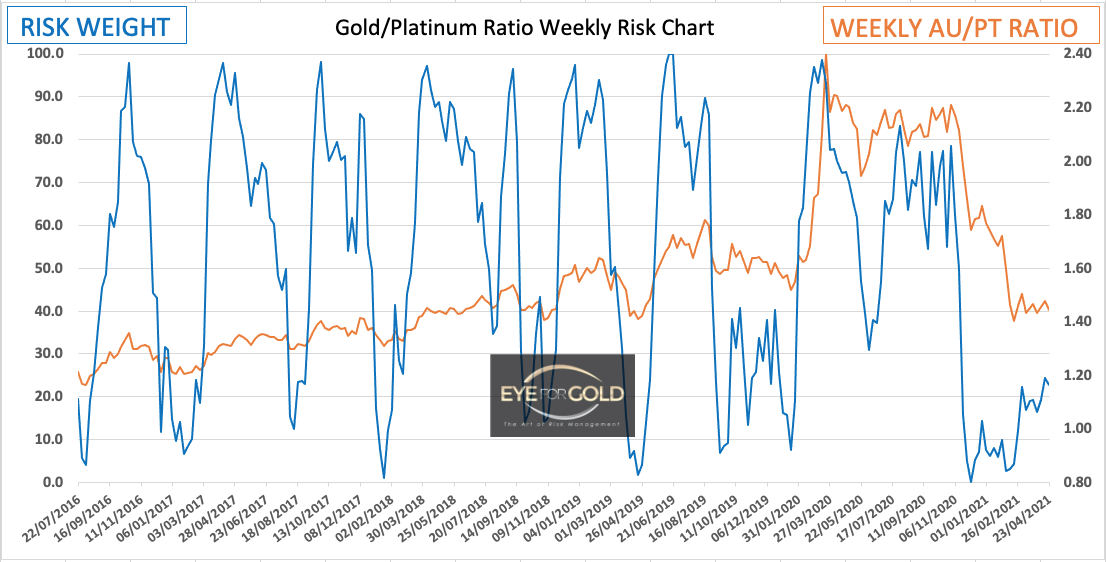
As we can see, since 2016 we have seen many sharp risk weight corrections based on relatively minor price moves. The picture looks similar, but we could experience a slightly longer (a few weeks) correction as the trend is currently up. Daily may keep the lid on though. No change to long term outlook of reaching parity with Gold.
As long as the risk weight trend is down we have to rely on shorter term time scales to determine an exit. As seen in 2013 reaching a risk weight bottom may still push prices down for another 2 or even 3 months. How far down cannot be predicted. Direction is more important than price. We must not 'bottom pick' an investment as long as long term risk trends are down. The objective is parity with Gold which usually means an even larger move, but time will tell.
The quarterly risk weigh trend is moving into the low risk range. The trend is still down however and as clearly visible in the chart above from various moves over the past 50 years it could be many quarters before we reach the end of the current GOLD/PLATINUM cycle. If we have to make a prediction which in itself is pretty useless: a minimum of 2 years up to 5.

