Platinum still looks strong enough to reach that long term sub 1:1 equilibrium versus gold | 13 August
Platinum Price Forecast relative to Long Term Monthly - Medium Term Weekly - Short Term Daily - and Hourly (not shown) data.
PLATINUM FORECAST
(Previous week in brackets)
| Platinum USD | Monthly | Weekly | Daily | |||
|---|---|---|---|---|---|---|
| 1026 (980) | ||||||
| PT Trend | ↓ (↓) | ↑ (↓) | ↑ (↓) | |||
| PT % Risk Weight |
52 (50) | 13 (10) | 43 (5) | |||
| PM Distribution Total allocation 40% (50%) |
Pt:33% | Ag:33% | Au:33% | |||
Platinum / USD live price
Platinum comment
13 August 2021 close Platinum is still the Rolls Royce of Precious metals with the highest weight per ounce or gram of all precious metals at 21,400 KILO per cubic meter (m3). Platinum is much less liquid than gold or Silver and can be used like the other PM's for various industrial applications as well as jewelry. Platinum is the long term play we have been waiting for the past 13 years.
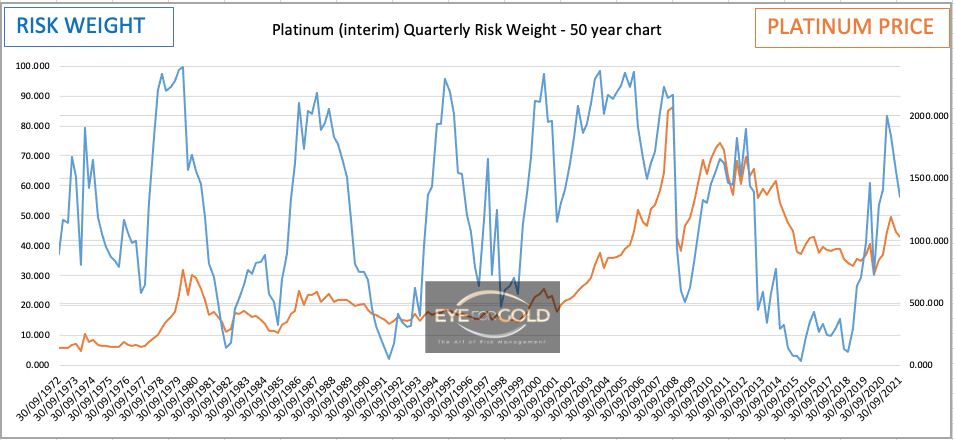
Versus USDollar, Platinum has now fallen back to the bottom of the channel which runs parallel from the bottom in March 2020 to the line drawn between the high of Jan 2020 and the high of Febr 2021. Short movements and corrections aside, Medium term weekly risk weight looks close to a bottom if not already reached last week. Monthly has yet to produce bearish divergence which could be even one year or longer from now. Quarterly risk weight (see chart below) has yet to fulfill a proper top formation. Physical Platinum is a long term hold in its own right. No Change.
06 August 2021 close Our platinum allocation has lost further ground but still some 6% above entry level. The position remains on hold as we see no indication for Platinum to suffer as it did early 2020. Even so, the quarterly print below feels similar to the 2000/2001 move leading into a fresh bottom followed by a major advance which ended at $2000+ in 2008. Chart wise, the 2020 bottom is typical for a major longer term bottom besides the historically unusual apathy for Platinum, which is and will always be the hardest precious metal in the universe with a great industrial purpose. It may be that a major purpose, catalyst coverters is seen as a key demand degenerator. The Platinum price however should continue to be very attractive for both jewelry and renewed industrial interest. Daily and Weekly risk weight have dropped into oversold zones whilst Long term Monthly is fairly neutral at 50% risk appraoching a 50% price correction ($947) between the 2020 low and the 2021 high. Platinum too has yet to crack a proper bearish divergence in the medium and long term risk weight scales. Hence no change to our long term hold.
GOLD/PLATINUM Ratio Price Risk Trend
(Previous update in brackets)
| Gold Platinum ratio | Monthly | Weekly | Daily | |||
|---|---|---|---|---|---|---|
| 1.7320 (1.7955) |
||||||
| Trend | ↑ (↑) | ↓ (↑) | ↓ (↑) | |||
| % Risk Weight |
38 (38) | 86 (97) | 46 (100) | |||
| PM Distribution Total allocation 40% (50%) |
Pt:33% | Ag:33% | Au:33% | |||
Gold/Platinum Ratio Charts
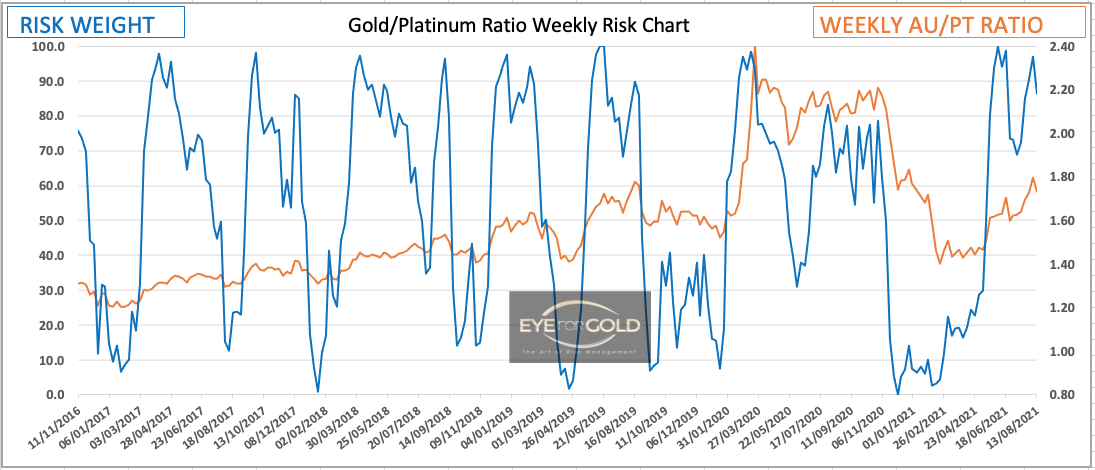
Having reached exactly 1.80 at the peak of the current correction last week, the analysis Gold/PT ratio is key to the decision to hold Platinum in our portfolio. Platinum subsequently dropped to 1.73 with risk weight dropping equally rapid to just below 50%. This may be indicative of another market attempt to dump PT which then should almost certainly lead to a bearish divergence risk to price sequence.
Monthly risk weight either develops a new down trend following the sharp rally since April or stall and turn back down once the Medium Weekly risk weight trend drives the ratio price lower.
Either way we should expect the short and meium term picture to lead the long gterm direction as long as Long term haven't made a proper technical bottom, which they historicall almost always do. Exception are V bottoms at very low risk percentages with a running bullish divergence on the shorter term scales.
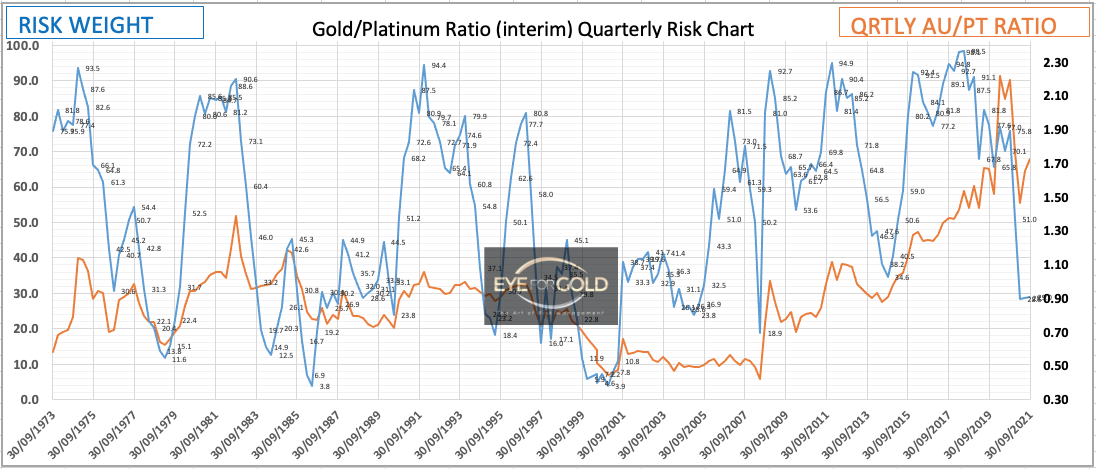
Quarterly risk weight is stalling since Q2 at around 32% with a fairly strong underlying price correction. This price correction is only the first more serious correction since the ratio peaked in March 2020. A much lower bottom can be expected well into the future and probably in the 5 to 15% risk weight percentage window.
Platinum/Silver Ratio Charts
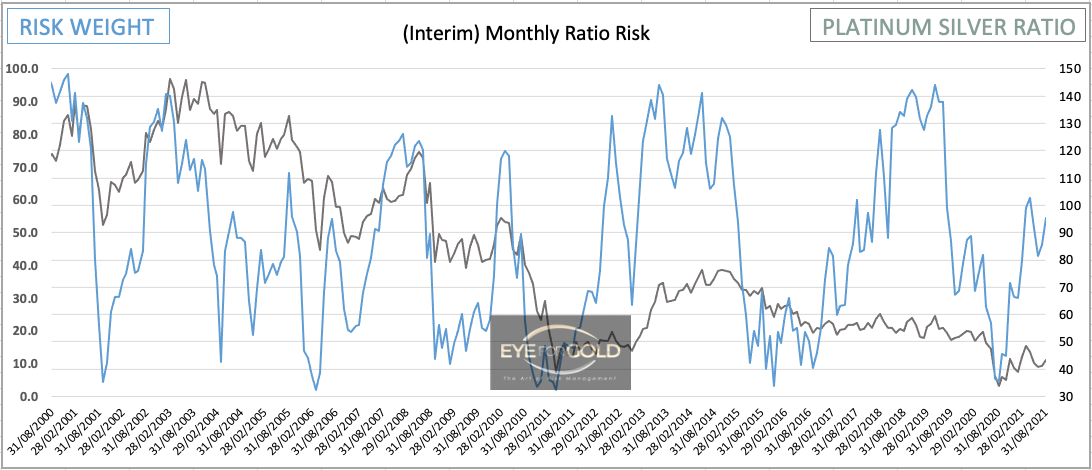
Again, monitoring the technical position of the Platinum Silver ratio helps understanding how Platinum should perform in our portfolio. The broader picture of the individual precious metals versus the USD or Euro or GBP and the ratio's which of course are independent from fiat currency give a fairly complete picture for holding and releasing metals from the portfolio. A generally weak metals picture coupled with a potentially very strong ratio gives more comfort to hold both metals, whereas a weak metals picture with a very neutral ratio would be reason to release a position. The technical picture is simply determined by a set of observations and experience using a number of price tools.
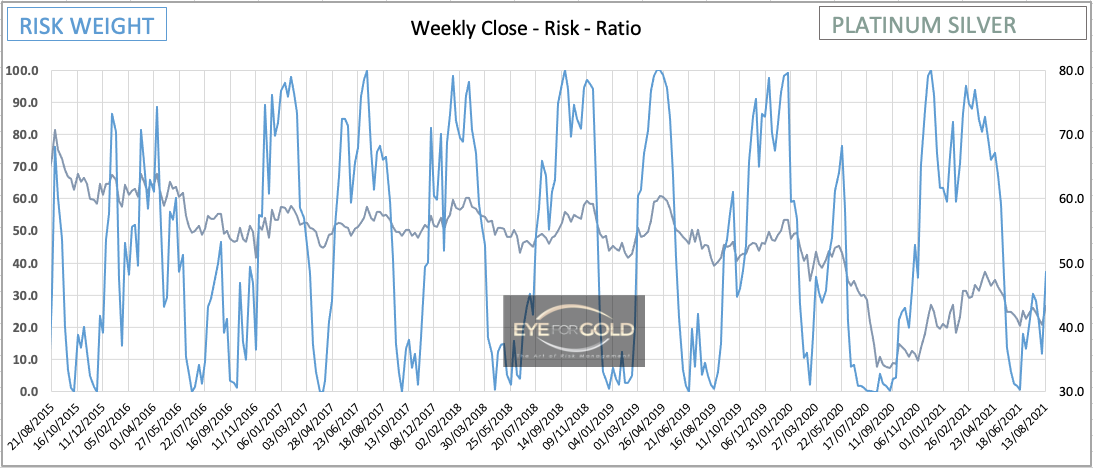
Daily Platinum vs Silver ended last week with the risk trend turning down. This trend is likely to follow through and meet a bullish diverging weekly trend. Essentially a hold for Platinum.
The bullish risk weight to price divergence between the last two bottoms since middle of June with the price ratio now finishing just above 43 signal a potentially longer move. Whilst Daily pushes down the medium term weekly indicators are showing strength. Hold Platinum.
Monthly risk weight and price are up indicating a fairly strong put look for Platinum vs Silver. Whilst Silver should re-attempt a stronger position versus Gold, Platinum is attempting to make up ground versus bot Gold and Silver. If anything Platinum could be the leading overweight metals position, but risk and lower market liquidity make it safer if the position is balanced. If our outlook turns out to be correct the financial reward will suffice. Platinum typically is stronger in a generally strong metals space always preceding Gold (and Silver) by one or two years.
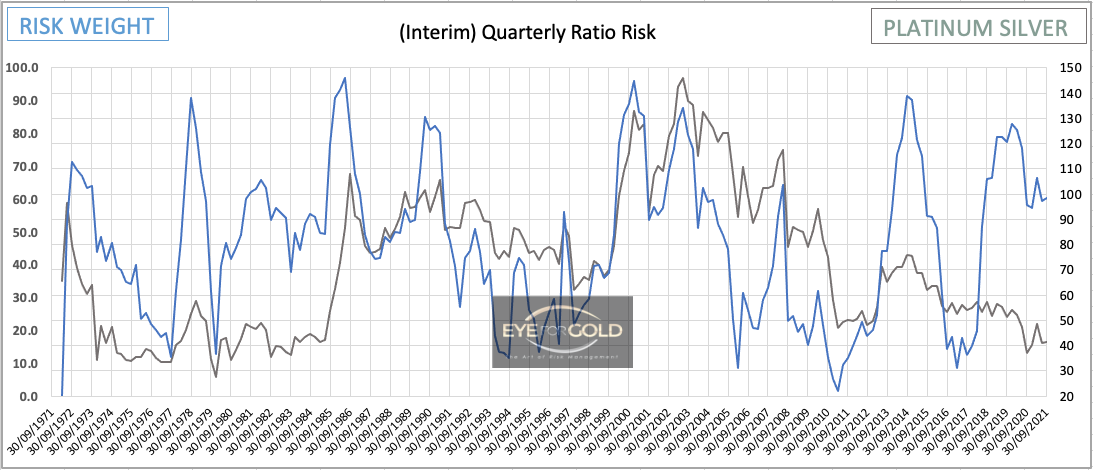
The Quarterly indicator is not very clear besides that what ever happens with this ratio in the next few quarters, we either established the strong bullish divergence in Q2 2020 of we will get another one confirming Platinum is on the rise versus Silver. If Silver were to explode to the upside as some market analysts have been suggesting for a very long time, Platinum is likely to follow. We still s prefer this ration to rally back into long term equiibrium. The 50 year (18,263 days) or Daily closing average Platinum Silver ratio (since August 15 1971) = 73,39. This would be our initial long term target for at least part of the position against last Friday's close of 43.29. Another 70% to go.

