Silver allocation to be reduced in favor of Gold & Platinum | 12 March 2021
Silver Price Forecast relative to Long Term Monthly - Medium Term Weekly - Short Term Daily - and Hourly (not shown) data.
SILVER FORECAST
(Previous week in brackets)
| Silver/USD | Monthly | Weekly | Daily | |||
|---|---|---|---|---|---|---|
| 25.83 (25.18) ↑2.6% |
||||||
| Trend | ↑ (↑) | ↓ (↓) | ↑ (↓) | |||
| % Risk Weight |
80 (70) | 48 (40) | 34 (22) | |||
| PM Distribution Total allocation 50% (55%) |
Pt:35% | Ag:35% | Au:30% | |||
Silver/USD live price
Silver comment
12 March 2021 close: Last week we printed a false risk level for monthly Silver (53 instead of 70, which we adjusted). The technical picture is changing a little in favor of Gold and Platinum. Silver has shown very strong advances in recent weeks but for Gold but this could be short lived. As we are still inside our initial expected equilibrium range we'd be looking to reduce silver allocation from 35% to just under 30%, but only if the Hourly Gold Silver ratio drops into an oversold condition, which could be Monday or Tuesday. See the Gold/Silver ratio analysis below.
5 March 2021 close: Silver is still some 17% above its long term support at 21.60 established since August 2020 in a broadly 8 dollar price range. If we look at US average silver price and inflation, the current $25/26 Silver price reflects a steady pattern and a minimum expected price level around 2020. The sharp fall of precious metals these past few days looks to come to and end where gold may well be the weakest going forward. Silver also looks weaker versus gold short term. Silver Long term trends, Monthly and Quaterly are still up even though quarterly is stalling in the interim. End of March will tell more about this very long term risk pattern, but the trend is sclearly not finished. The evenly balanced allocation between metals remains the preferred position although we may be looking to shift a bit towards physical platinum in coming weeks if the ratio's provide a bit more direction. The sharper drop on Thursday and friday is also the result of a longer term channel being broken than which is never a strong technical signal. Monthly risk weight is still up and the leading timescale in a long term trend that started one year ago next week. Otherwise no change.
Silver risk analysis
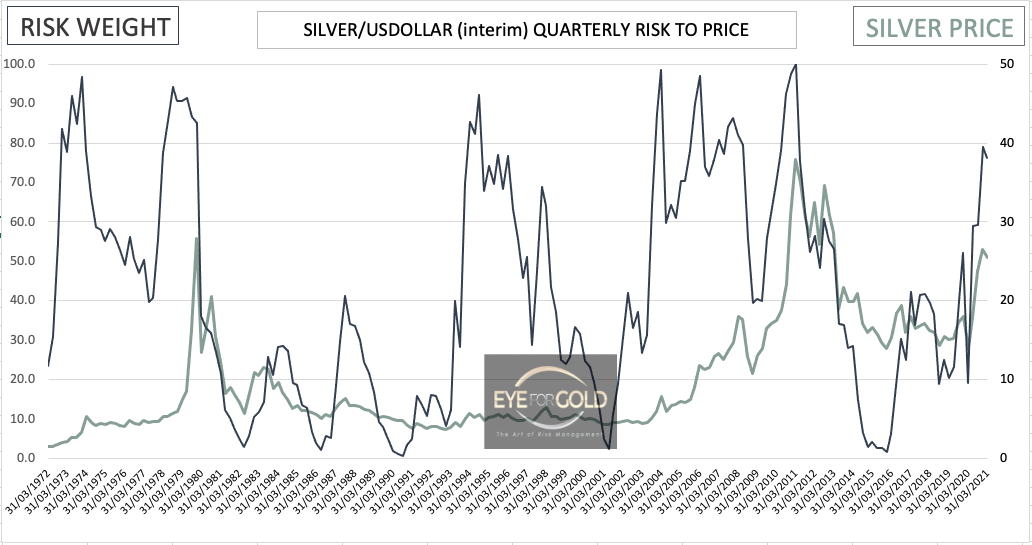
12 March 2021: The broad long term risk trend for Silver is up, but with the Monthly Gold/Silver ratio in deep oversold range at 4% risk, we could see a bit of a correction, which may even be volatile. Hence some potential caution after a long but sharp silver correction during the past 12 months. It does not change our long term outlook which remains very form, hence a minor adjustment in allocation and only if the hourly Gold/Silver ratio gives that signal the coming week.
5 March 2021: The interim quarterly chart now shows a potential shorter term correction, but the present reading is interim and the actual trend will be set nearer the end of this quarter. This long term uptrend has not finished by a good margin and will experience hurdles along the way. Reason to stay long term positive on Silver.
GOLD/SILVER Ratio Price Risk Analysis
(Previous week in brackets)
| GOLD/SILVER Ratio | Monthly | Weekly | Daily | |||
|---|---|---|---|---|---|---|
| 66.30 (67.13) | ||||||
| Trend | ↓ (↓) | ↑ (↓) | ↓ (↑) | |||
| % Risk Weight |
4 (5) | 20 (20) | 54 (55) | |||
| PM Distribution Total allocation 50% (55%) |
Pt:35% | Ag:35% | Au:30% | |||
Gold/Silver Ratio live price
Gold Silver ratio analysis
12 March 2021 close: Hourly risk is in a sharp downtrend and not finished whilst Daily risk is in fairly neutral ground making up its mind. Weekly may show bullish divergence and Monthly risk is still down but in deeply oversold territory. This is the reason we may be triggered to reduce our silver allocation only by 5% in favor of both Gold and Platinum.
5 March 2021 close: We haven't broken the 62 level which makes it harder short term to reach the lower long term equilibrium level. The first objective has been achieved and given the sharp increase of daily risk weight we must evaluate this short term correction before making a small adjustment to our allocation. The present 67 ratio level is already a 10 years equilibrium which means there is no strong risk argument to strongly favour Gold or Silver, hence no reason the change the present allocation percentage.
PLATINUM/SILVER Ratio Price Risk Analysis
(Previous week in brackets)
| PLATINUM/SILVER Ratio | Monthly | Weekly | Daily | |||
|---|---|---|---|---|---|---|
| 46.59 (44.74) | ||||||
| Trend | ↑ (↑) | ↑ (↑) | ↑ (↑) | |||
| % Risk Weight |
51 (49) | 92 (90) | 48 (43) | |||
| PM Distribution Total allocation 50% (55%) |
Pt:35% | Ag:35% | Au:30% | |||
Platinum/Silver Daily 12 March
12 March 2021 close: The straight uptrend last week is strong but can be expected to pause for a day or two. Short term this market is pointing up, which gives a bit more comfort to PT than AG. The coming days may see just a little bit of swap from Silver to Platinum. As this ratio is not widely traded it is more difficult to keep track of say 10 minute by 10 minute moves, but it serves as an indicator for the broader trend and our still favoured precious metals portfolio allocation.
5 March 2021 close: Daily risk weight is now in divergence position having dropped rapidly with much price change. This signal is bullish given our fair expectation for a return towards historic equilibrium between 60 and 70. As we already have a balanced distribution of precious metals, which is a must hold in its own right, we may transfer up to 10 or 15 percent of our Silver allocation into Platinum. But no change for now.
Platinum/Silver Weekly 12 March
12 March 2021 close: Weekly risk weight has landed in a high risk range now at 90% and could show bearish divergence upon turning down. We believe though that Long term Monthly and Quarterly risk are leading and which should drive this ratio closer to equilibrium around 65. This still favors PT over AG longer term.
5 March 2021 close: Weekly Platinum/Silver has turned down and may have finished the medium term uptrend with a mild bearish divergence. The long term trend however is still up and Daily risk shows bulloish divergence vs weekly. This technical picture gives preference to a Hold on Platinum and maybe a minor re-allocation in favor of Platinum.
12March 2021 close: Monthly risk weight at 50% is in a strong uptrend and offers plenty room for a strong Platinum advance in coming months. PT favoured over AG.
5 March 2021 close: Monthly risk weight is still in the earlier stages of an uptrend towards our forecast range of 60-70. It can take many months before this level is reached. Platinum therefore remains a strong hold within the precious metals portfolio. We actually trade physical platinum via the Bitpanda exchange (not for US and CAN citizens) which is relative price friendly with a BEST holders discount on commissions. Storage fees are 0.5% per annum.
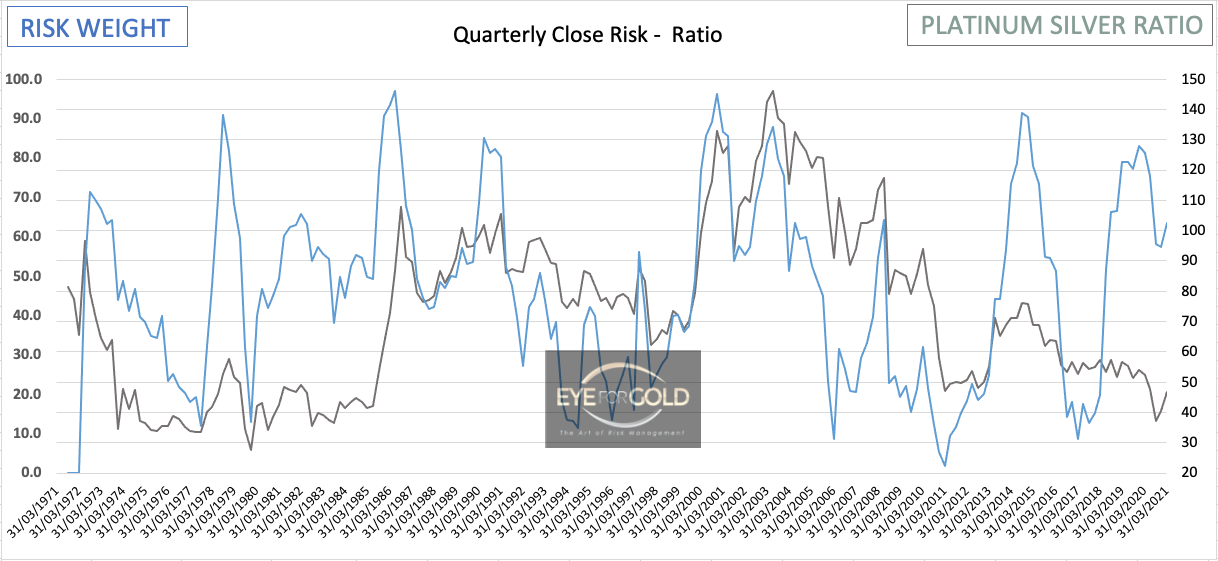
12 March 2021 close: Interim quarterly which ends in 2 1/2 weeks still has the benefit of a high level bullish divergence developing, but not finished in Q1 2021. With the PT/AG Ratio still well below long term equilibrium and risk weight just over 60% there is plenty time space to reach our objectives. PT favoured over AG which justifies the equal to larger PT allocation vs Gold and Silver.
5 March 2021 close: As mentioned last week the quarterly turning up at a much higher level from a low price point is bullish, but me must appreciate the risk of this being a fals signal given the 3 weeks left till end of the quarter. We lean towards a bullish signal because price equilibrium is around 65 which should drive the expected Platinum to Silver ratio higher by another 40% from the present 45 level.


