Silver, Gold/Silver prediction October – Q4 2021
Silver Price Forecast relative to Long Term Monthly - Medium Term Weekly - Short Term Daily - and Hourly (not shown) data.
SILVER FORECAST
(Previous update in brackets)| Silver/USD | Monthly | Weekly | Daily | |||
|---|---|---|---|---|---|---|
| 24.28 (23.26) | ||||||
| Trend | ↓ (↓) | ↑ (↑) | ↓ (↑) | |||
| % Risk Weight | 37 (36) | 33 (22) | 86 (82) | |||
| Total PM Portfolio allocation 40% (40%) breakdown: | Pt:16% | Ag:12% | Au:12% | |||
Silver/USD live price
Silver comment
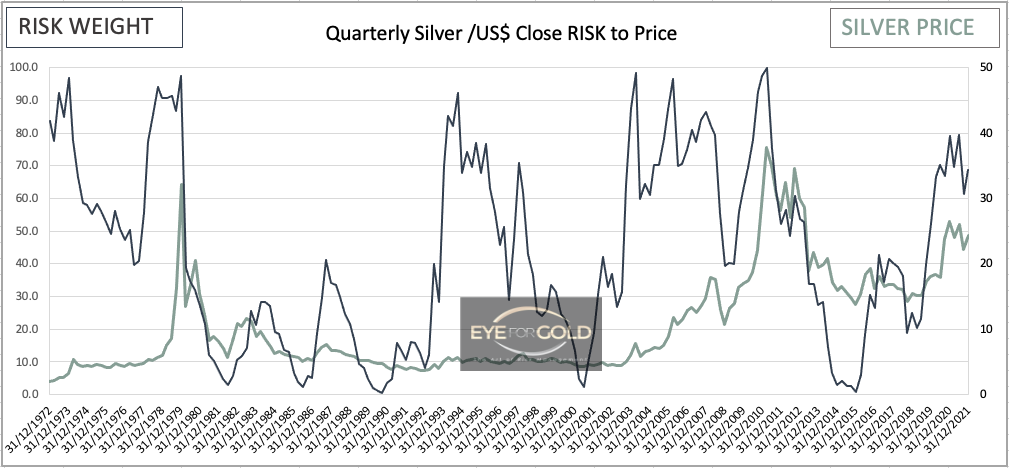
22 October 2021 close: Silver technical position, following another week of positive price action (+4%), looks more favourable and thus gives an emotional signal to increase the position relative to Gold and Platinum. The length of the consolidation that started at the peak in August 2020 however is still hard to predict although Silver volatility typically send this very precious metal much higher and much faster and take quarterly risk in the 90+% risk range. Holding physical Silver is the most important aspect right now and whilst it also looks stronger vis a vis Platinum and Gold in the short term we prefer to stick with the balanced allocation between Gold and Silver joinly accounting for 60% of our total precious metals portfolio. Long term Hold, No Change
15 October 2021 close: Silver improved nearly 3% for the week and did about 2.5% better than gold. The technical risk weight picture is not conclusive although medium term risk weight is making a bullish divergence formation with strong support at the $21 handle. we patiently hold on to our 12% of total portfolio allocation with physical silver.
GOLD/SILVER Ratio Price Risk Analysis
(Previous update in brackets)
| GOLD/SILVER Ratio | Monthly | Weekly | Daily | |||
|---|---|---|---|---|---|---|
| 73.55 (75.60) | ||||||
| Trend | ↑ (↑) | ↓ (↓) | ↓ (↓) | |||
| % Risk Weight |
47 (48) | 62 (74) | 10 (15) | |||
| Total PM Portfolio allocation 40% (40%) breakdown: |
Pt:16% | Ag:12% | Au:12% | |||
Gold/Silver Ratio live price
Gold Silver ratio analysis
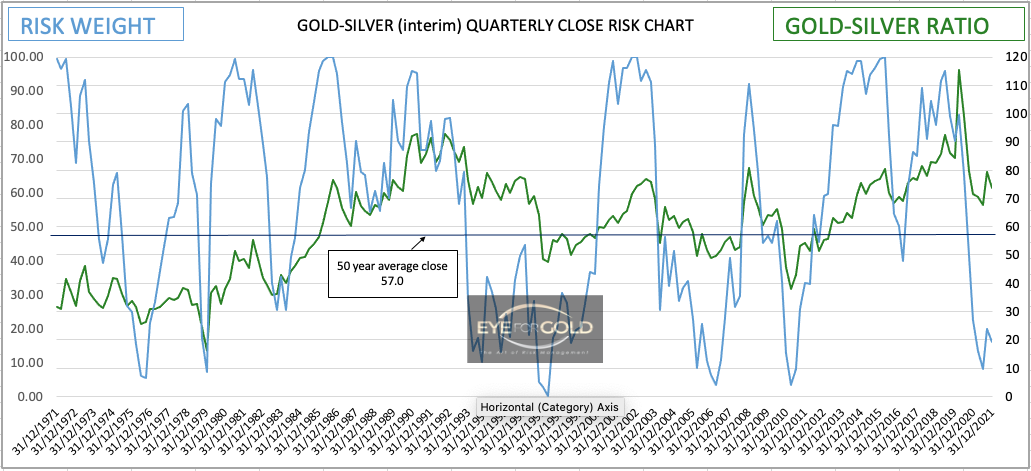
22 October 2021 close: Gold/Silver ration dropped nearly 3% as Silver bounced more than Gold, Whilst Platinum remained flat to slightly down. We maintain our long term outlook for the Gold/Silver ratio to reach its 50 year average on a closing basis which for all time intervals (Daily, Weekly, Monthly and Quarterly) lies around a Gold to Silver ratio of 57. And if it goes there it typically will follow through with some momentum. This means a minimum drop of 22.5% from Friday's close at 73.55.
15 October 2021 close: The Gold/Silver ratio is starting to show a stronger silver side developing. Silver has gained 6% from the recent ratio high at 80.63 and looks it may continue this trend. As the down trend that started in March 2020 is of primary nature we would historically expect at least one bullish divergence to develop in the monthly time interval. This is yet to happen. Once the Precious metals space finds a new lease of life all metals will benefit and for now we are happy to maintain the present allocation distribution. We will update if some special market event triggers a fresh comment.
08 October 2021 close: The most critical technical reading for the Gold/Silver ratio is weekly risk weight which turned from up to down at 82% with a minor bearish divergence setup. Daily already reach a bearish divergence a week ago and this lifts the chances for silver to start coming back towards the 50 years average quarterly close. The horizontal black line of the quarterly Gold/Silver chart below is that average calculated from Q1 1968. We expect the average to be broken within the next few years although that moment could be any length of period between now and then. No Change to our stock position.


