Silver has become a precious commodity | 19 Febr 2021
Silver Price Forecast relative to Long Term Monthly - Medium Term Weekly - Short Term Daily - and Hourly (not shown) data.
SILVER FORECAST
(Previous week in brackets)
| Silver/USD | Monthly | Weekly | Daily | |||
|---|---|---|---|---|---|---|
| 27.23 (27.31) ↑1.6% |
||||||
| Trend | ↑ (↑) | ↑ (↑) | ↓ (↓) | |||
| % Risk Weight |
52 (53) | 52 (47) | 45 (51) | |||
| PM Distribution Total allocation 50% (55%) |
Pt:35% | Ag:35% | Au:30% | |||
Silver/USD live price
Silver comment
19 February 2021 close: Silver looks technically bullish trading close to its 2 year support and showing medium and long term risk weight in uptrends at neutral levels. Silver always was a more industrial commodity, which has now become an essential industrial commodity requiring more than full annual production of just under 1 billion ounces. If there is going to be a silver squeeze, it will be a most natural event that shouldn't surprise anyone. Speculators who only buy paper silver products, yet assuming physical risk, will eventually pay the price of divergence between paper and physical. We are getting so much closer to a point of no return. Phyical Silver is a strong patient hold.
12 February 2021 close: Daily Silver risk weight since last October eyes like a stable heart rate oscillator whilst the price has moved from $22 to $27. Based on long term price comparisons with Gold, Silver has basically performed very similar to gold with a 27 months advance of around 80%. Similar as Gold, the Medium and Long term risk weight indicators look positive and we expect a rally towards our next target of $37 fairly soon. Precious metals are also in the picture, or will be soon, with the crypto community, simply because there is so much discussion on social/alternative media. If something goes wrong in crypto, which it surely will for some tokens, traders will also look for safehavens beyond other crypto tokens. Gold, Silver, Platinum and a few other commodities can become very sought after, hence safe to establish a physical position whilst fair pricing with acceptable margins is still available.
5 February 2021 close: Silver ended just a touch lower than on Jan 29, at 26.88, and after a turbulent 14% peak to bottom. The SLV squeeze story probably made many more people aware of the precious metals market in general and Silver in particular. Even though the precious metals market is huge, very few retail investors are interested to stay with it or even acquire a small amount due to relatively high cost of storage and very high trading margins from bullion traders. However, a GME type buy and 'Hodl' operation will not be necessary to wake up the Silver whales. Moving even a small amount of fiat currency into physical Silver today will make that happen if done by enough people around the globe. Silver for wealth preservation purchase is available from refiners and bullion dealers but supply is limited. Physical silver isx best purchased by opening an account with companies or exchange that covers your purchase with an exact of excess amount of physical silver stored relatively cheap and in bulk with the major storage companies. Storing physical metal outside of your own tax jurisdiction is important. Austria, Switzerland, Singapore, Australia and new Zealand are examples. USA, Canada and UK are not favored storage locations for legal and other economic reasons. A little bit of help requires just a few million people to acquire an average of 500 troy ounces and absorb a whole year of production. One year Silver production is about one billion ounces or 27 Billion dollars at this week's silver price. That is 3.3% of TESLA market cap. like Gold, Silver is a likely candidate commodity to restore trust in the world's major fiat currencies. Physical Silver is a Buy and Hold until further notice. No Change.
Silver risk analysis
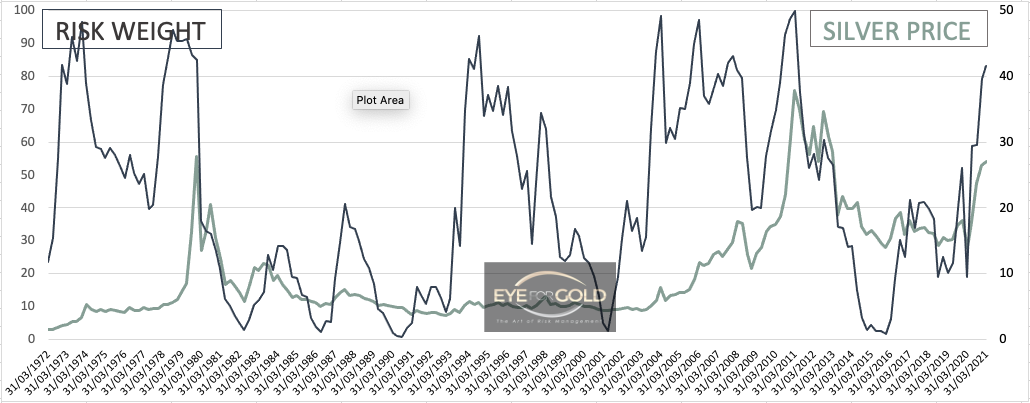
19 February 2021: The Quarterly chart is in uptrend still, with risk weight at 83%, and appears to be in the type of momentum as seen back in 2004/5. Typically, risk weight is expected to become overbought and then diverge upon a much higher price target. It is still posssible that Silver can outpace Platinum against the current best odds, which only amplifies the need for a more diversified portfolio of precious metals. This chart is telling us Silver has a long way to go potentially.
Note: Our quarterly risk weigth to price chart published on 31/12/2020 was accidently smoothed during the massive March 2020 correction which calculated a slighgtly higher risk weight reading than actual. Actual was 79% instead of 85%. It does not change the overal reading.
GOLD/SILVER Ratio Price Risk Analysis
(Previous week in brackets)
| GOLD/SILVER Ratio | Monthly | Weekly | Daily | |||
|---|---|---|---|---|---|---|
| 65.26 (66.55) | ||||||
| Trend | ↓ (↓) | ↑ (↓) | ↓ (↓) | |||
| % Risk Weight |
5 (6) | 21 (18) | 35 (45) | |||
| PM Distribution Total allocation 50% (55%) |
Pt:35% | Ag:35% | Au:30% | |||
Gold/Silver Ratio live price
Gold Silver ratio analysis
19 February 2021 close: The Gold Silver ratio lost 2 points this week closing at 65.26. The pressure is still on as is evidenced by hourly risk moving up quickly to 75% after reaching a 15% low risk bottom with price at 64.50 on Friday. The recent 62 handle low is a serious pitential trigger level for a multi months pause, although the long term downtrend in play should first develop bullish risk to price divergence to signal a long term bottom. Weekly risk weight is today in such potential bullish divergence position which is why any immediate short term price extensions to the downside may call for a medium term ratio bottom. Any market rumours of certain major players swapping gold to silver at these levels should be taken with a pinch of salt. Major players would already have the position and only looking to unwind some or all of it. A market to closely watch nonetheless. No Change for now.
12 February 2021 close: The relative bearish divergence of Daily risk weight versus Weekly could trigger another move down in the ratio. Weekly risk has bullish divergence status and Monthly is in the deep oversold range. Not finished which means anything can still happen and fast. Several hourly closings at 66.30 or lower may trigger a move towards the recent low of 62.13 with Daily risk narrowing into oversold again. This 62 handle will be a level to watch for anyone with a heavier silver portfolio weight. At current price levels it is more important from a risk management perspective to own physical silver rather than looking for a more speculative weighting that could perhaps be more profitable in fiat terms. If we break 60 however, then 30 does become a serious target again.
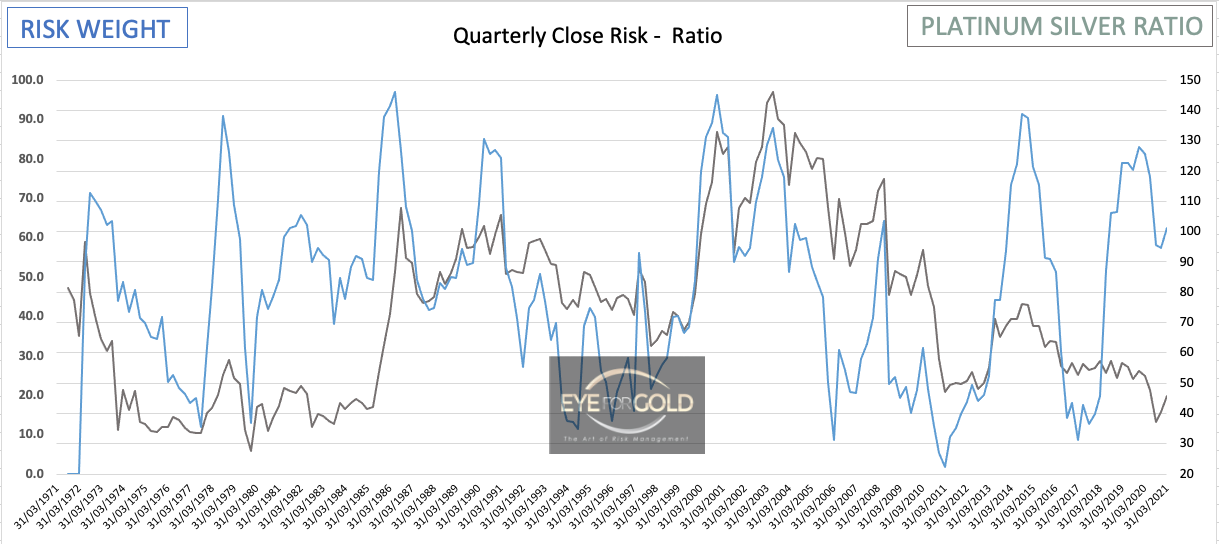
19 February 2021 close: The 50 year (1971-2921) average daily close of the Platinum to Silver ratio is 88. This high number relative to Gold Silver is somewhat flattered due to the 200-2008 period with prices well above 100. The 1980's also produced several above 100 Pt/AG ratio's. We may get a short term correction but the Medium and Long term risk weight charts still show unfinished uptrends.
12 February 2021 close: This week we add the Platinum to Silver ratio analysis starting with Quarterly closing prices since the Gold standard for Central banks was removed in 1971. 50 years of Platinum Silver ratio history which gives a further piece of assistance of how to approach a balanced distribution of Precious metals in the portfolio.
Click on the chart to open a full size light box. We know that Platinum has been the weakest of the precious metals since 2012. What is particularly interesting to notice on this Platinum Silver chart is that Platinum actually peaked against silver in 2003 and has been declining since making that spike bottom in March 2020. What is mnore interesting is that Risk weight is now bottoming at a much higher level (57%) against a much lower Ratio price of 37 in March 2020. That is massive bullish divergence which is likely to result in not only Platinum fully removing its divergence against gold from an equilibrium of around 0.88 but also starting to make up lost ground against silver. The 50 year quarterly average close of the Platinum/Silver ratio is 74. That is the average of 200 data points. Hence, the potential for Platinum to recover towards that average against Gold and Silver is substantial. Not a reason to go all in on Platinum but enough reason to maintain a low risk 30-35% allocation to Platinum in the Precious metals portfolio.
19 February 2021 close: A strong uptrend is in place still which justifies maintaining our slightly overweight Platinum hold in the precious metals portfolio.
19 February 2021 close: The Quarterly risk chart is alittle tricky as risk weight shot higher during ther 2016-2020 consolidation, then dropped only mildly before turning up after the Ratio bottomed at around 32 in September 2020.
The 50 year average of the Platinum/Silver ratio is 73.0. We would expect Platinum to perform well versus silver based on the present risk trends, but this may change if silver suddenly gets squeezed or simply takes charge of the precious metals space. We'd be looking for the ratio to reach the 65.0 level prior, but even if the ratio turns down again, which is likely to only happen based on a avery strong silver price and not a much weaker platinum price, the balanced portfolio of 30% Gold, 35% silver and 35% Platinum should continue to perform well as expected.


