Silver USdollar and Gold/Silver ratio risk position 04 September
Silver Price Forecast relative to Long Term Monthly - Medium Term Weekly - Short Term Daily - and Hourly (not shown) data.
SILVER FORECAST
(Previous update in brackets)| Silver/USD | Monthly | Weekly | Daily | |||
|---|---|---|---|---|---|---|
| 24.69 (23.98) | ||||||
| Trend | ↓ (↓) | ↑ (↑) | ↑ (↑) | |||
| % Risk Weight | 58 (66) | 22 (20) | 82 (62) | |||
| PM Distribution Total allocation 40% (40%) | Pt:33% | Ag:33% | Au:35% | |||
Silver/USD live price
Silver comment
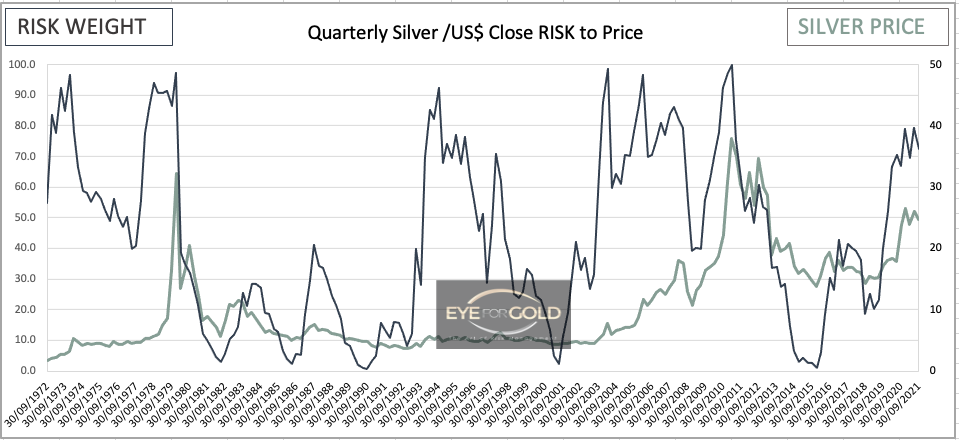
03 September 2021 close: Silver rallied close to 3% last week making good some lost ground versus gold. We still favor the read that silver has ended or is about to end a one year consolidation between $30 and $20. Qaurterly risk below is not conclusive with a technical picture that could lengthen the price consolidation further or take a northerly or southerly direction. No change, HODL!
27 August 2021 close: Silver/USD worked its way below the one year triangle during the past 3 weeks but clearly held horizontal support for that same one year period. This is important. The coming month will be one to watch although we expect a similar trend to develop as for gold given that our indocators all have low risk readings in a medium term Weekly timescale. We do not see bullish divergence which can also indicate that we are still in that major uptrend which started in March 2020 and because we have yet to witness an expected bearish divergence from a higher price top. Patient long term hold.
GOLD/SILVER Ratio Price Risk Analysis
(Previous update in brackets)
| GOLD/SILVER Ratio | Monthly | Weekly | Daily | |||
|---|---|---|---|---|---|---|
| 73.95 (75.44) | ||||||
| Trend | ↑ (↑) | ↓ (↑) | ↓ (↓) | |||
| % Risk Weight |
32 (20) | 85 (86) | 25 (60) | |||
| Total PM Portfolio allocation 40% (40%) |
Pt:33% | Ag:33% | Au:33% | |||
Gold/Silver Ratio live price
Gold Silver ratio analysis
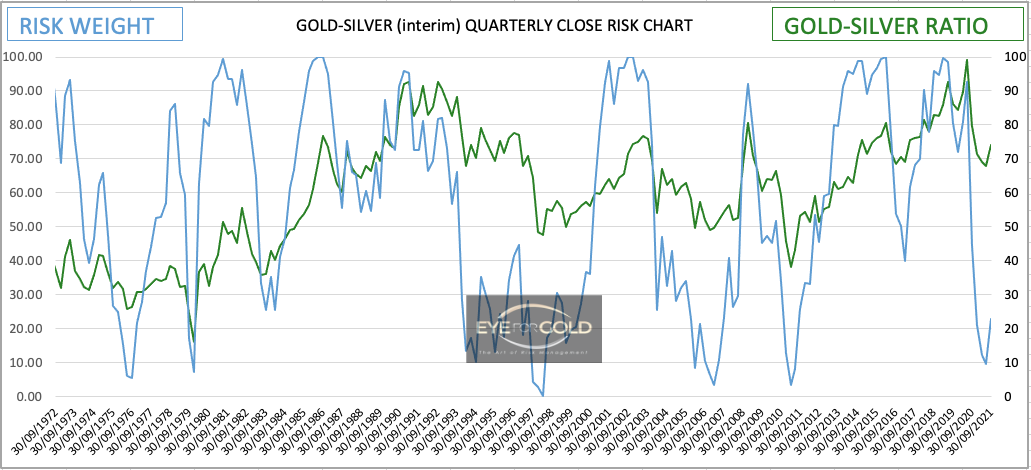
03 September 2021 close: On August 20, Gold Silver ratio peaked at 77.75 and now appears to have found fresh interest for Silver. Friday's strong down move (-2.5%) favors an intermediate continuation of this countertrend correction. The Quarterly uptrend risk chart is, like the Silver/USD quarterly risk chart, not conclusive to support a full silver allocation, but since the primary trend is down Gold/Silver ratio risk should shown a much lower risk coupled with a much lower ratio than what has been shown last year. Silver to remain an equally balanced allocation in the portfolio.
27 August 2021 close: Shorter term timescales are clearly more favourable looking for Silver to resume its long term gold equilibrium adjustment. MOnthly and Quarterly however still have a potentially broader weight to carry the Gold/Silver ratio further towards the 80 handle.
This reading does not call for a short term weight shift in the balanced precious metals portfolio. No Change.


